Exploring Statistical Inference: Estimation and Significance Testing Methods
This document delves into fundamental statistical inference methods, focusing on estimation of population parameters and significance testing for hypotheses. Chapter 5 explores estimation techniques such as point estimation and confidence intervals, exemplified by General Social Survey (GSS) data. Chapter 6 examines significance testing, highlighting the impact of spending on happiness. Key concepts include confidence levels, standard error, and sample size determination, offering practical applications for researchers in various fields.

Exploring Statistical Inference: Estimation and Significance Testing Methods
E N D
Presentation Transcript
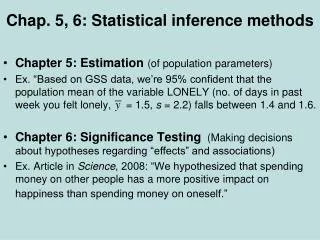
Chap. 5, 6: Statistical inference methods • Chapter 5: Estimation (of population parameters) • Ex. “Based on GSS data, we’re 95% confident that the population mean of the variable LONELY (no. of days in past week you felt lonely, = 1.5, s = 2.2) falls between 1.4 and 1.6. • Chapter 6: Significance Testing (Making decisions about hypotheses regarding “effects” and associations) • Ex. Article in Science, 2008: “We hypothesized that spending money on other people has a more positive impact on happiness than spending money on oneself.”
5. Statistical Inference: Estimation Question: How can we use sample data to estimate values of population parameters? Point estimate: A single statistic value that is the “best guess” for the parameter value Interval estimate: An interval of numbers around the point estimate, that has a fixed “confidence level” of containing the parameter value. Called a confidence interval. (Based on sampling distribution of the point estimate)
Point Estimators – Most common to use sample values • Sample mean estimates population mean m • Sample std. dev. estimates population std. dev. s • Sample proportion estimates population proportion (the proportion in a particular category; e.g. yes to a question)
Confidence Intervals • A confidence interval (CI)is an interval of numbers believed to contain the parameter value. • The probability the method produces an interval that contains the parameter is called the confidence level. Most studies use a confidence level close to 1, such as 0.95 or 0.99. • CIs have the form point estimate ± margin of error with margin of error based on spread of sampling distribution of the point estimator; e.g., margin of error 2(standard error) for 95% confidence.
Confidence Interval for a Proportion • Recall that the sample proportion is a mean when we let y = 1 for observation in category of interest, y = 0 otherwise • Recall the population proportion is the mean µ of a probability distribution having • The standard deviation of this probability distribution is • The standard error of the sample proportion is
The sampling distribution of a sample proportion for large random samples is approximately normal (CLT) • So, with probability 0.95, sample proportion falls within 1.96 standard errors of population proportion • There is 0.95 probability that • Once the sample selected, we’re 95% confident that • This is the CI for the population proportion
Finding a CI in practice • Complication: The true standard error itself depends on the unknown parameter! In practice, we estimate and then find the 95% CI using the formula
Example: What percentage of 18-22 year-old Americans report being “very happy”? • Recent GSS data: 35 of n = 164 say they are “very happy” (others report being “pretty happy” or “not too happy”) • 95% CI is 0.213 ± 1.96(0.032), or 0.213 ± 0.063, (i.e., “margin of error” = 0.063) • which gives (0.15, 0.28). We’re 95% confident the population proportion who are “very happy” is between 0.15 and 0.28. • Problem 5.3 and 5.7
Suppose sample proportion of 0.213 was based on n = 4x164 = 656 (instead of 164) 95% CI is 0.213 ± 1.96(0.016), or 0.213 ± 0.031, which is (0.18, 0.24). Recall 95% CI with n = 164 was (0.15, 0.28) Greater sample size gives narrower CI (quadruple n to halve width of CI) These se formulas treat population size as infinite Problem 5.9, 5.11 (and 5.17)
Some comments about CIs • If we repeatedly took random samples of some fixed size n and each time calculated a 95% CI, in the long run about 95% of the CI’s would contain the population proportion .
General formula for CI for proportion is • In practice, the method is ok if at least 15 observations fall in the category of interest and at least 15 observations fall not in it. (ex. n=164, 35 “very happy”, 164 – 35 = 129 not “very happy”, condition satisfied). • Choose the z-value such that the prob. for a normal dist. within z standard errors of mean equals desired confidence level (e.g., z=1.96 for 95% confidence, z=2.58 for 99% conf.) • Method requires “large n” so sampling distribution of sample proportion is approximately normal (CLT) and estimate of true standard error is decent.
Choosing the Sample Size • Ex. How large a sample size do we need to estimate a population proportion (e.g., “very happy”) to within 0.03, with probability 0.95? • i.e., what is n so that the margin of error of is 95% and the confidence interval is 0.03? • Set 0.03 = margin of error and solve for n
Solution • Largest n value occurs for = 0.50, so we’ll be “safe” by selecting n = 4268(0.50)(0.50) = 1067. • Problem 5.35 • If we only need a margin of error of 0.06, require • What is the size of n? What happens to n, if you want to double precision?
What if we can make an educated “guess” about proportion value? • If previous study suggests population proportion is roughly about 0.20, then to get margin of error 0.03 for 95% CI, (instead of n = 1067) • It’s “easier” to estimate a population proportion as the value gets closer to 0 or 1 ( = 0.50 require largest sample) • Better to use an approximate value for rather than 0.50 unless you have no idea about its value.