Download
1 / 43
430 likes | 687 Views
Short-run decision making and CVP Analysis. Marginal costing and contribution. When using marginal costing, managers will often consider the size of the contribution when making production decision Contribution is the difference between sales revenue and variable costs

E N D
Marginal costing and contribution • When using marginal costing, managers will often consider the size of the contribution when making production decision • Contribution is the difference between sales revenue and variable costs • It may be defined as the profit before the recovery of fixed costs • In marginal costing, closing stock are valued at their marginal production cost (Marginal cost/quantity)
Applications of marginal costing • It might be used in the following circumstances • Evaluating special order decisions • Deciding whether to make or buy in a particular product or component • Deciding which products to produce • Deciding what to produce when resources are scarce • Deciding what price to charge
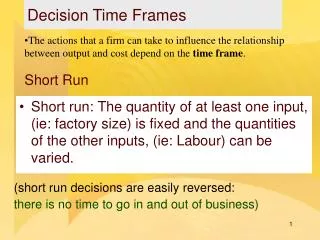
Short run decision making • These are decisions which seek to make the best use of existing facilities. • Typically, in the short run, fixed cost remain unchanged so that the marginal cost, revenue and contribution of each alternative is relevant. • In these circumstances the selection of the alternative which maximises contribution is the correct decision rule.
Acceptance of a special order • By this is meant the acceptance or rejection of an order which utilises spare capacity, but which is only available if a lower than normal price is quoted.
Example 1- Acceptance of a special order • X Ltd makes a product which sells for £1.50. • The output for the period is 80,000 units of product which represents 80% capacity • Total costs are £90,000 and of these it is estimated that £26,000 are fixed costs. • A potential customer offers to buy 20,000 units at £1.10 and this will use up the company’s spare capacity. • Should management accept this special order?
Additional factors to consider when accepting a special order • Capacity- Is this special order the most profitable way of using the spare capacity • Future orders- The company might be prepared to accept a lower contribution in the hope that the customer will make bigger, more profitable orders in future • Customer response- Will the acceptance of one order at a lower price lead other customers to demand lower prices as well • Will the special order lock up capacity which could be used for future, full price business • Is it absolutely certain that fixed costs will not alter.
Activity 1-Acceptance of special order • D Ltd manufacture and market cola they sell for 20 p per can. • Current output is 400,000 cans per month which represents 80 % of capacity. • They have the opportunity to utilise their surplus capacity by selling their product at 13 p per can to a supermarket chain which sell it at their own label product. • Total cost for the last month were £ 56,000 of which £ 16,000 were fixed costs. This represented a total cost of 14 p per can. • Based on the above data should D Ltd accept the supermarket order?
Limiting factor or principal budget factor • A factor which is a binding constraint upon the organisation. • The limiting factor may be any resource e.g. materials, labour or machine hours, lack of space, availability of finance. • Management has to decide what is the best way to allocate the scarce resource among the product range in the most effective way so that profits are maximised. • Where a single binding constraint can be identified, the general objective is to chose the alternative which maximises the contribution per unit of the key factor
Activity 2 - choice of product where limiting factor exist A special machine is used to manufacture the three products and there are only 15,000 machine hours available. Product X uses 20 machine hours per unit. Product Y uses 5 machine hours per unit. Product Z uses 2 machine hours per unit. Which product should be manufactured first?
Make or Buy decisions • Sometimes management may have to consider whether it is best to manufacture products or components or to sub-contract them out and purchase them externally • If a business does decide to buy in products or components the following additional factors might be taken into consideration:- • Before contracting out to an external supplier, a business must be confident that supplier can meet delivery times and quantities • Quantity of the product must also be considered
Example 2- Make or buy decisions Example: A company makes product P. The cost of the current production level of 50,000 units are: Direct materials £2.5 Direct wages £1.25 Variable overheads £1.75 Fixed cost £ 3.50 ------ Total cost of production £9.00 Component P could be bought in for £ 7.75 and, if so, the production capacity utilized at present would be unused. Assuming that there are no overriding technical considerations, should P be bought or manufactured?
Shut down decisions/ dropping a product • Often management wish to analyze the performance of their products, branches, divisions. • Based on following data, advise management whether product C should be discontinued
Activity 3- Shut-down decisionsShould department C be closed?
Activity 4-Dropping a product • A company produces three products for which the following operating statement has been produced: X Y Z Total Rs Rs Rs Rs Sales 32,000 50,000 45,000 127,000 Total costs 36,000 38,000 34,000108,000 Net profit/Loss (4000) 12,000 11,00019,000 • The total costs comprises 2/3 variable and 1/3 fixed • The directors consider that product X shows a loss and should be discontinued • Based on the above cost data should Product X de dropped?
Pricing decisions • The price at which a good may be sold is usually decided by a number of factors • The need to make a profit • Market demand • A requirement to increase market share for a product • Maximum utilization of resources • Marginal costing can help management to decide on pricing policy
Activity 5- Pricing decisions • Gamebusters produce and sell computer games at $ 30 per game. • Each year 6,000 of the games are sold. • The marketing director suggests that, if the price is reduced to $ 28,sales will increase to 8,000 games • The sales manager thinks that sales will increase to 11,000 games if the price is reduced to $ 25.
Activity 5- Pricing decisions (Cont…) • The following information is available for 6,000 games • Direct materials $ 48,000 • Direct labour $ 66,000 • Variable selling expenses $ 12,000 • Fixed expenses $48,000 • Required:- • Calculate the profit or loss from the sale f (i) 6,000 (ii) 8,000 (iii) 11,000 units and recommend which option should be adopted
Relevant information:- • Future costs and revenues- Past cost and revenues are only useful in so far as they provide a guide to the future. Costs already spent, known as sunk costs,a re irrelevant for decision making • Differential costs and revenues- Only those costs and revenues which alter a a result of a decision are relevant. Where factors are common to all the alternatives being considered, they can be ignored.
Situation when dropping product X:- Rs Contribution product Y 24,667 Contribution product Z 22,333 Total Contribution 47,000 Less fixed cost 36,000 Net profit 11,000 Other factors that need to be considered:-
Other factors that need to be considered • Although product X does provide some contribution, it is at a low rate and alternative more profitable products or markets should be considered. • The assumption above was that the fixed costs were general fixed costs which would remain even if X was dropped. If dropping X resulted in the reduction of fixed cost by more than Rs 8,000 then the elimination would be worthwhile. However, this is unlikely.
Example A company is able to produce four products and is planning its production mix for the next period. Estimated sales and production data follow:- Product w x y z SP per unit 29 36 61 51 Labour (@£5/hr) 15 10 35 25 Materials(@£1/kg) 6 18 10 12 Contribution 8 8 16 14 Product w x y z Resources/units Labour (Hours) 3 2 7 5 Materials (Kg) 6 18 10 12 Maximum Demand 5,000 5,000 5,000 5,000
Based on the above data, which is the most appropriate product mix under the following assumptions:- If labour hours are limited to 50,000 in a period If material is limited to 110,000 kgs in a period
Break-even analysis • Term given to the study of the interrelationships between costs, volume and profit at various levels of activity. • The term break-even analysis is commonly used, but it is somewhat misleading as it implies that the only concern is with that level of activity which produces neither profit nor a loss-the break-even point. • However the behaviour of costs and profits at other cost levels is usually of much greater significance. • Because of this an alternative term, cost-volume-profit analysis (C-V-P analysis) is used.
Contribution and profit • Contribution is a term meaning ‘making a contribution towards covering fixed costs and making a profit’. • Before a firm can make a profit in any period, it must first of all cover its fixed costs. • Breakeven is where total sales revenue for a period just covers fixed costs, leaving neither profit nor loss. • For every unit sold in excess of the breakeven point, profit will increase by the amount of the contribution per unit.
Contribution Margin – = Variable Costs Sales $500,000 – $300,000 = $200,000 Formula for and computation of contribution margin • Contribution margin is one of the key relationships in CVP analysis and is the amount of revenue remaining after deducting variable costs. • Assume a company sells 1,000 VCRs in one month, sales are $500,000 (1,000 X $500) and variable costs are $300,000 (1,000 X $300). • Thus, Contribution margin is $200,000 computed as follows:
Many managerial decisions require an analysis of the behavior of costs and profits as a function of the expected volume of sales. • In the short run, the costs and prices of a firm's products will, in general, be given. • The principal uncertainty, therefore, is not the cost or price of a product, but the quantity that will be sold. • Thus, the short‑run profitability of a product line will be most sensitive to the volume of sales. Cost‑volume‑profit (C‑V‑P) analysis highlights the effect of changes in volume on profitability.
Uses of C-V-P analysis • Cost-volume- profit analysis can answer a number of analytical questions. Some of the questions are as follows: • What is the breakeven revenue of an organization? • How much revenue does an organization need to achieve a budgeted profit? • What level of price change affects the achievement of budgeted profit? • What is the effect of cost changes on the profitability of an operation?
Objectives of Cost-Volume-Profit Analysis • In order to forecast profits accurately, it is essential to ascertain the relationship between cost and profit on one hand and volume on the other. • Cost-volume-profit analysis is helpful in setting up flexible budget which indicates cost at various levels of activities. • Cost-volume-profit analysis assist in evaluating performance for the purpose of control. • Such analysis may assist management in formulating pricing policies by projecting the effect of different price structures on cost and profit.
Following are the assumptions on which the theory of CVP is based: • Changes in activity are the only factors that affect costs. • There is linear relationship between revenue and cost. • The unit selling price, unit variable costs and fixed costs are constant. • The analysis either covers a single product or assumes that the sales mix ( ratio of each product to total sales) sold in case of multiple products will remain constant as the level of total units sold changes. • All revenue and cost can be added and compared without taking into account the time value of money. • Costs can be classified accurately as either fixed or variable.
Activity A company makes a single product with a sales price of Rs 10 and a marginal cost of Rs 6. Fixed costs are Rs 60,000. Calculate:- • Number of units to break even • Sales at break-even point • C/S ratio • What number of units will need to be sold to achieve a profit of Rs 20,000 per annum • What level of sales will achieve a profit of Rs 20,000 per annum • If the taxation rate is 40 % how many units will need to be sold to make a profit after tax of Rs 20,000 • Because of increasing costs the marginal cost is expected to rise to Rs 6.50 per unit and fixed costs to Rs 70,000 p.a. If the selling price cannot be increased what will be the number of units required to maintain a profit of Rs 20,000 p.a? Ignore taxation.
Margin of Safety (MOS) • It is calculated as the difference between sales or production units at the selected activity and the breakeven sales or production. • Margin of safety is the difference between the total sales (actual or projected) and the breakeven sales. It may be expressed in monetary terms (value) or as a number of units (volume). • A large margin of safety indicates the soundness and financial strength of business.
Actual (Expected) Sales Break-even Sales Margin of Safety in Dollars – = Formula for margin of safety in dollars • The formula for determining the margin of safety in dollars is shown below. The size of margin of safety is an extremely valuable guide to the strength of a business. If it is large, there can be substantial falling of sales and yet a profit can be made. On the other hand, if margin is small, any loss of sales may be a serious matter.
Margin of Safety in Dollars Actual (Expected) Sales Margin of Safety Ratio ÷ = $250,000 ÷ $750,000 = 33% Formula for margin of safety ratio The formula and calculation for determining the margin of safety ratio are:
Activity A company producing a single article sells it at $ 10 each. The marginal cost of production is $ 6 each and fixed cost is $ 400 per annum. You are required to calculate the following: • Profits for annual sales of 1 unit, 50 units, 100 units and 400 units • C/S ratio • Breakeven sales • Sales to earn a profit of $. 500 • Profit at sales of $. 3,000 • New breakeven point if sales price is reduced by 10% • Margin of safety at sales of 400 units
How to improve margin of safety • If margin of safety is unsatisfactory, possible steps to rectify the causes of mismanagement of commercial activities as listed below can be undertaken. • Increasing the selling price-- It may be possible for a company to have higher margin of safety in order to strengthen the financial health of the business. It should be able to influence price, provided the demand is elastic. Otherwise, the same quantity will not be sold. • Reducing fixed costs • Reducing variable costs • Substitution of existing product(s) by more profitable lines e. Increase in the volume of output • Modernization of production facilities and the introduction of the most cost effective technology
Break-even analysis- Graphical approach • Traditional break even chart:- • A company makes a single product with a total capacity of 400,000 litres p.a. Cost and sales data are as follows: • Selling price Rs 1 per litre • Marginal cost Rs 0.50 per litre • Fixed cost Rs 100,000 • Draw a break even chart showing the likely profit at the expected production level of 300,000 litres
The contribution break even chart • A company makes a single product with a total capacity of 400,000 litres p.a. Cost and sales data are as follows: • Selling price Rs 1 per litre • Marginal cost Rs 0.50 per litre • Fixed cost Rs 100,000 • Draw a break even chart by plotting the following:- • The Total cost line • The marginal cost line • The total revenue line
Uses of Breakeven Chart A breakeven chart can be used to show the effect of changes in any of the following profit factors: • Volume of sales • Variable expenses • Fixed expenses • Selling price
Activity A manufacturer incurred the following costs in a period for his sole product:- Rs Labour (25 % variable) 8,000 Materials (100 % variable) 12,000 Selling costs (10 % variable) 2,000 Other costs (fixed) 7,000 Total costs 29,000 A normal period’s sales are 500 units at Rs 70 each, but up to 650 units could be made in a period. Various alternatives are being considered:- • Reduce the price to Rs 63 each and sell all that could be made • Increase the price to Rs 80 each at which price sales would be 400 units • Keep the present plan What is the most profitable pan? What are the C/S ratio? What is the break-even point for each alternative.
Limitations • Break-even analysis is only a supply side (ie.: costs only) analysis, as it tells you nothing about what sales are actually likely to be for the product at these various prices. • It assumes that fixed costs (FC) are constant • It assumes average variable costs are constant per unit of output, at least in the range of likely quantities of sales. • It assumes that the quantity of goods produced is equal to the quantity of goods sold (i.e., there is no change in the quantity of goods held in inventory at the beginning of the period and the quantity of goods held in inventory at the end of the period). • In multi-product companies, it assumes that the relative proportions of each product sold and produced are constant (i.e., the sales mix is constant).