Analysis Functionality to enhance MATLAB default interpolation schema using mGstat
Analysis Functionality to enhance MATLAB default interpolation schema using mGstat. Maya Smith (Winston Salem State University) Mentor: John Paden, Kyle Purdon (Kansas University). ABSTRACT

Analysis Functionality to enhance MATLAB default interpolation schema using mGstat
E N D
Presentation Transcript
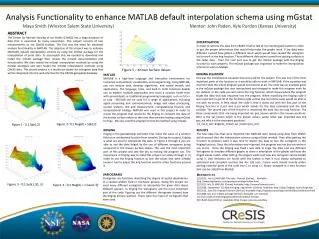
Analysis Functionality to enhance MATLAB default interpolation schema using mGstat Maya Smith (Winston Salem State University) Mentor: John Paden, Kyle Purdon (Kansas University) ABSTRACT The Center for Remote Sensing of Ice Sheets (CReSIS) has a large database of data that is examined by many researchers. This project consists of two enhancements to the CReSIS toolbox. The first was the need for extended analysis functionality in MATLAB. The objective of this project was to enhance MATLAB's default interpolation schema by using the mGstat package for the interpolation of point data. To accomplish this we needed to download and install the mGstat package then review the mGstat documentation and functionality. We then tested the mGstat interpolation methods by using the mGstat examples and later tested the mGstat interpolation methods using CReSIS data. The second project is a JavaScript viewer for echogram data that will be integrated into the web interface for the CReSIS geospatial database. INTERPOLATION In order to retrieve the data from CReSIS I had to talk to my mentor/grad student in order to get the proper information that would help make the graphs work. If the data were different I would have gotten a different result which would have caused the variogram not to work in the krig function. These different data points come from picking surfaces in the radar data. Then the next part was to get the mGstatpackage with the Kriging function to work properly. The mGstatpackage was important to make the interpolation scheme to work in Matlab. Figure 5 – Known Surface Values KRIGING EQUATION This was the interpolation equation that was used for the project. This was one of the most important parts of the function so it would be able to work in MATLAB. If the equation was incorrect then the whole program would not execute at all. The code was an example given in the mGstat package that was manipulated and changed to make this program work for our dataset. In the code you will notice the krig function, which shows where the program Krigesthe data that was imported into the program. When modifying the Krigingcode it was important to get all of the functions right so that the rest of the code would be able to run with no errors. A little about the code is that it starts out with the first part of the Krigingfunction is d_est and d_var which stands for the data estimated and the data variable. The second part of the function is importing the data into the krig function. The three components that are being imported are pos_known which is the known positions. Next is the val_known which is the known values. Lastly, what was imported was the pos_est which is the estimated positions: [d_est,d_var]=krig(pos_known,val_known,pos_est) MATLAB MATLAB is a high-level language and interactive environment for numerical computation, visualization, and programming. Using MATLAB, you can analyze data, develop algorithms, and create models and applications. The language, tools, and built-in math functions enable you to explore multiple approaches and reach a solution faster than with spreadsheets or traditional programming languages, such as C/C++ or Java. MATLAB can be used for a range of applications, including signal processing and communications, image and video processing, control systems, test and measurement, computational finance, and computational biology. MATLAB was used in this project in order to create the program that would do the Kriging to compare the data of the known surface values to the ones that we were testing using mGstatto Krige. We also used this program to test the method using mGstat. Figure 2-‘0.1 Nug(0) + Sph(1)’ Figure 1- ‘0.1 Sph(.2)’ RESULTS The final data files that were imported into MATLAB were tested using data from CReSIS which proved that the interpolation schema using mGstatworked. Then after getting the function to properly work it was time to import the data to test the variogram in the Krigingfunction. Once the information was imported, the program was ran but not without any errors. Once the Krigingwas fixed I was able to Krige the data and use different Variograms to simulate different graphs to show a description of the glacier and how the Kriged values match. After testing, the project works and now any variogram can be tested using it. One limitation we found with the toolset is that it runs slowly compared to optimized and compiled routines like Arc GIS uses. Future work should include either porting essential parts of the code into C or using a C library wrapped in a mex function that can be called from Matlab. KRIGING Kriging is the geostatistical estimator that infers the value of a random field at an unobserved location from samples. During the project, Kriging is what we used to interpolate the data. In Figure 1 through 4 you are able to see the data Kriged by the use of different variograms being compared to the Known Surface Values. This was the most important part of this project and was the key to making the program run. The importance of Kriging was to make this project run solely through it. In order to use the Krigingfunction to test the values that were already known I had to adjust the krig function and the other functions around it. • VARIOGRAMS • Variograms are functions describing the degree of spatial dependence of a spatial random field or stochastic process. Doing this project we used many different variograms to interpolate the given data about different glaciers. In Krigingthe Variogramsare the most important part of the code. Figuring out the different Variograms showed how the Krigingprocess worked. There were four types of variograms that were used. • References • [1] (2013, July 22) MATLAB: Tutorials - Manual [Online]. Available: http://www.mathworks.com/products/matlab/videos.html • [2](2013 July 9) MATLAB: [Online} Available: http://www.w3schools.com/ • [3] (2008 , September 12) Native kriging algorithms [Online]. Available: http://http://mgstat.sourceforge.net/ • [4] (2012, June 29) Kriging Functions [Online]. Available: http://mgstat.sourceforge.net/htmldoc/estimation.html • [5] (2008 July 22 ) mGstat package [Online]. Available: svn checkout svn://svn.code.sf.net/p/mgstat/code/trunk/mGstat mGstat • [6] CReSIS Data [Online]. Available: https://www.cresis.ku.edu/data Figure 3 -‘0.1 Sph(1,30,.3) Figure 4 -‘0.1 Nug(0) + 1 Gau(1.5)’