Download
1 / 39
420 likes | 738 Views
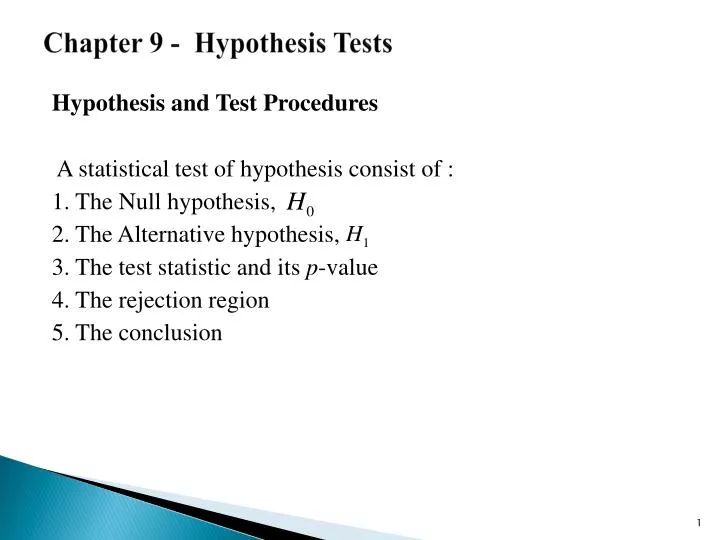
Chapter 9 - Hypothesis Tests. Hypothesis and Test Procedures A statistical test of hypothesis consist of : 1. The Null hypothesis, 2. The Alternative hypothesis, 3. The test statistic and its p -value 4. The rejection region 5. The conclusion. Definition 9.1:

E N D
Chapter 9 - Hypothesis Tests Hypothesis and Test Procedures A statistical test ofhypothesis consist of : 1. The Null hypothesis, 2. The Alternative hypothesis, 3. The test statistic and its p-value 4. The rejection region 5. The conclusion
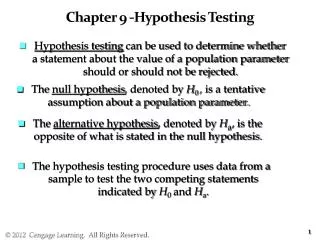
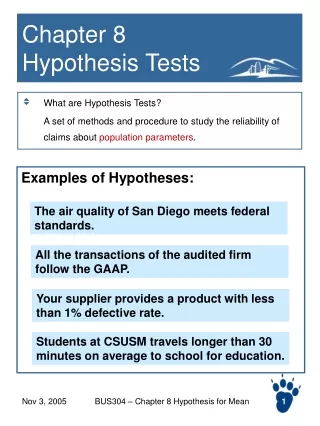
Definition 9.1: Hypothesis testing can be used to determine whether a statement about the value of a population parameter should or should not be rejected. Null hypothesis, H0 : A null hypothesis is a claim (or statement) about a population parameter that is assumed to be true. (the null hypothesis is either rejected or fails to be rejected.) Alternative hypothesis, H1 : An alternative hypothesis is a claim about a population parameter that will be true if the null hypothesis is false.
Test Statistic is a function of the sample data on which the decision is to be based. • p-value is the probability calculated using the test statistic. The smaller the p-value, the more contradictory is the data to .
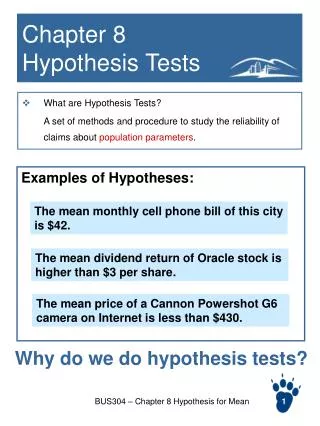
9.1 Developing Null and Alternative Hypothesis • It is not always obvious how the null and alternative hypothesis should be formulated. • When formulating the null and alternative hypothesis, the nature or purpose of the test must also be taken into account. We will examine: • The claim or assertion leading to the test. • The null hypothesis to be evaluated. • The alternative hypothesis. • Whether the test will be two-tail or one-tail. • A visual representation of the test itself. • In some cases it is easier to identify the alternative hypothesis first. In other cases the null is easier.
9.1.1 Alternative Hypothesis as a Research Hypothesis • Many applications of hypothesis testing involve • an attempt to gather evidence in support of a • research hypothesis. • In such cases, it is often best to begin with the • alternative hypothesis and make it the conclusion • that the researcher hopes to support. • The conclusion that the research hypothesis is true • is made if the sample data provide sufficient • evidence to show that the null hypothesis can be • rejected.
Example 9.1: A new drug is developed with the goal of lowering blood pressure more than the existing drug. • Alternative Hypothesis: • The new drug lowers blood pressure more than • the existing drug. • Null Hypothesis: • The new drug does not lower blood pressure more • than the existing drug.
9.1.2 Null Hypothesis as an Assumption to be Challenged • We might begin with a belief or assumption that • a statement about the value of a population • parameter is true. • We then using a hypothesis test to challenge the • assumption and determine if there is statistical • evidence to conclude that the assumption is • incorrect. • In these situations, it is helpful to develop the null • hypothesis first.
Example 9.2 : The label on a soft drink bottle states that it contains at least 67.6 fluid ounces. • Null Hypothesis: • The label is correct. µ> 67.6 ounces. • Alternative Hypothesis: • The label is incorrect. µ < 67.6 ounces.
Example 9.3: Average tire life is 35000 miles. • Null Hypothesis: µ = 35000 miles • Alternative Hypothesis: µ≠ 35000 miles
9.1.3How to decide whether to reject or accept ? The entire set of values that the test statistic may assume is divided into two regions. One set, consisting of values that support the and lead to reject , is called the rejection region. The other, consisting of values that support the is called the acceptance region. H0 always gets “=“. Tails of a Test
9.2 Type I & Type II Error 9.2.1 Type I Error • Because hypothesis tests are based on sample data, • we must allow for the possibility of errors. • A Type I error is rejecting H0 when it is true. • The probability of making a Type I error when the null hypothesis is true as an equality is called the level of significance (α). • Applications of hypothesis testing that only control the Type I error are often called significance tests.
9.2.2 Type II Error • A Type II error is accepting H0 when it is false. • It is difficult to control for the probability of making a Type II error, β. • Statisticians avoid the risk of making a Type II error by using “do not reject H0” and not “accept H0”.
Type I and Type II Errors Population Condition H0 True H0 False Conclusion Do not rejectH0 Correct Decision Type II Error Type I Error Correct Decision RejectH0
9.3 Population Mean, , ( known and unknown ) Null Hypothesis : Test Statistic :
Definition 9.2: p-value The p-value is the smallest significance level at which the null hypothesis is rejected.
Example 9.5 When working properly, a machine that is used to make chips for calculators does not produce more than 4% defective chips. Whenever the machine produces more than 4% defective chips it needs an adjustment. To check if the machine is working properly, the quality control department at the company often takes sample of chips and inspects them to determine if the chips are good or defective. One such random sample of 200 chips taken recently from the production line contained 14 defective chips. Test at the 5% significance level whether or not the machine needs an adjustment.
9.5 Inferences About the Difference Between Two Population Means9.5.1 Interval Estimation of
Example 9.6 : The scientist wondered whether there was a difference in the average daily intakes of dairy products between men and women. He took a sample of n =50 adult women and recorded their daily intakes of dairy products in grams per day. He did the same for adult men. A summary of his sample results is listed below. Construct a 95% confidence interval for the difference in the average daily intakes of daily products for men and women. Can you conclude that there is a difference in the average daily intakes of daily products for men and women?
9.5.2 Hypothesis Test For the Difference between Two Populations Means, Test statistics:
Do Not Reject H 0 Reject H Reject H 0 0 1-α α/2 α/2 z=-1.96 z=+1.96
9.6 Inferences About the Difference Between Two Population Proportion,9.6.1 Interval Estimation of
Example 9.8: A researcher wanted to estimate the difference between the percentages of users of two toothpastes who will never switch to another toothpaste. In a sample of 500 users of Toothpaste A taken by this researcher, 100 said that the will never switch to another toothpaste. In another sample of 400 users of Toothpaste B taken by the same researcher, 68 said that they will never switch to another toothpaste. Construct a 97% confidence interval for the difference between the proportions of all users of the two toothpastes who will never switch.
Solutions Toothpaste A : n1 = 500 and x1 = 100 Toothpaste B : n2 = 400and x2 = 68 The sample proportions are calculated; Thus, with 97% confidence we can state that the difference between the two population proportions is between -0.026 and 0.086.
9.6.2 Hypothesis Test For the Difference between Two Population Proportion,
Example 9.9: Reconsider Example 9.8, At the significance level 1%, can we conclude that the proportion of users of Toothpaste A who will never switch to another toothpaste is higher than the proportion of users of Toothpaste B who will never switch to another toothpaste?