Download
1 / 40
400 likes | 510 Views
Nov 17 Verification Forecast Actual. Nov 17 Verification Forecast Actual. Mon Nov 24 :: Thanksgiving. 500 MB Jet Stream Patterns. Mon Nov 24 :: Thanksgiving. Surface Wind and Rain Patterns. What Does El Nino Mean to You?.

E N D
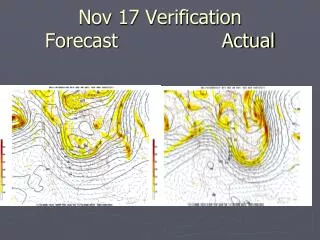
Nov 17 Verification Forecast Actual
Mon Nov 24 :: Thanksgiving • . 500 MB Jet Stream Patterns
Mon Nov 24 :: Thanksgiving Surface Wind and Rain Patterns
The Southern Oscillation • El Nino/La Nina are actually part of a much larger atmospheric phenomenon called the Southern Oscillation • Sir Gilbert Walker did a research study on the India monsoons and found a correlation between surface pressures on the eastern and western sides of the tropical Pacific (he looked at Darwin and Tahiti records) • Surface pressure rises on the one side of the tropical Pacific were accompanied by pressure falls on the other side • Gilbert called this see-saw effect the Southern Oscillation
The Walker Cell Circulation • Scientists studying the circulation patterns over the equatorial Southern Pacific realized the normal pressure patterns were the result of a circulation pattern called the Walker Cell • Based on this depiction of the Walker Cell circulation, where would the ‘bad’ weather be found?
Walker Circulation • Tends to strengthen and weaken over time • Typical cycle of intensity lasts @ 7 years • When strong the eastern Pacific High, Australian Low and trade winds are strongest • The link between Walker Cell circulations (Southern Oscillations) in the atmosphere, and oceanic temperature variations (eg El Nino) are often combined and referred to as ENSO
ENSO Evolution • Normal Walker Cell circulations would feature dry and wet weather in which part of the subtropical Southern Pacific? • What do you think happen to the above conditions when the Walker Cell weakens and then reverses?
Weak/Reversing Walker Cell Phase of the Southern Oscillation • Surface pressure systems are weaker • Trade winds weaken, then are reversed • Water in the Eastern Pacific warms • Less upwelling along South American Coast • Warm western Pacific surface waters may flow eastward • Precipitation shifts eastward • This is the El Nino (or warm phase) of ENSO
Focus on Precipitation Shift Eastward • Important for the large scale circulation patterns of the atmosphere • Remember: Clouds and precipitation release large amounts of latent heat into the atmosphere • So…eastward shift of atmospheric heating affects circulation, locations of semi-permanent highs and lows can be altered • Global weather patterns therefore are affected
What are El Nino’s • Relative to sea surface temperatures (SST) in the tropical Pacific, El Nino is the warm phase of the Southern Oscillation i.e. SST’s are warmer than normal • The change in jet stream and surface wind patterns when the Walker Cell circulation weakens provides a mechanism for warming of tropical Pacific waters
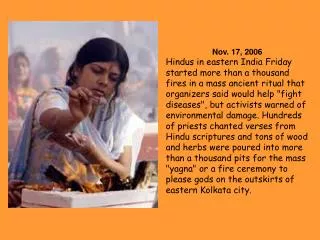
El Nino and Severe Weather • The term El Nino was first used by fishermen describe abnormally warm waters near the coasts of Equador and Peru. • The term El Nino means ‘The Christ Child’ since these warm waters typically began to appear during the Christmas season. • When the El Ninos’ appeared it negatively affected the fishing industry because fish become relatively scarce when coastal waters warmed up.
Why Study El Ninos? • Associated with unusual weather patterns in North America and the world • Ocean temperatures associated with El Nino can affect the intensity of individual storm events • Indications are that strong El Ninos are becoming more frequent (two of the strongest on record have occurred since 1980) • El Nino events show the interconnectedness of the ocean and atmosphere
All El Ninos Are Not The Same • Sea Surface Temperature (SST) rises may extend 5000 miles west of Peru • Weaker event SST’s may only be 1C above normal • Stronger event SST’s may be 2-4C above normal • Strength and areal coverage can result in differing seasonal weather patterns
Effects of Walker Cell Circulation on Southern Hemisphere Pacific Note: Circulation @ Highs is CCW in Southern Hemisphere
Consequences of El Nino • Droughts in Australia and Indonesia • Warm rainy weather in the eastern Pacific • Increased thunderstorms and flooding along the western South American coast • Warm water extending as far north as the US West Coast (different species of fish)
El Nino Effects on California Strong El Ninos
El Nino Effects on California Weak to Moderate El Ninos Strong El Ninos
El Nino Effects on Hurricanes • Slightly increases the number of strong Eastern Pacific Cyclones (SST increases cause this) • Decreases Atlantic hurricane activity due to increased upper level winds in the tropical Atlantic
La Nina • When the Southern Oscillation (Walker cell circulation) is stronger than normal we have a La Nina event (cold phase of ENSO) • Higher than normal pressure over the eastern Pacific, lower than normal pressure over Australia • La Niña - means "Infant Girl" in Spanish and is so named because in many ways it is the opposite of El Niño. • Stronger tropical Pacific easterlies enhance upwelling and sea surface temperatures become cooler than normal • Effects do not seem as pronounced as La Nina, but westward shift of Pacific precipitation does affect global circulation patterns
La Nina • Previous Cold (La Nina) Phases of ENSOLa Niñas occurred in 1904, 1908, 1910, 1916, 1924, 1928, 1938, 1950, 1955, 1964, 1970, 1973, 1975, 1988, 1995, and now 2007 • Typical La Niña ImpactsLa Niña tends to bring nearly opposite effects of El Niño to the United States — • The impacts of El Niño and La Niña at these latitudes are most clearly seen in wintertime. • Wetter than normal conditions across the Pacific Northwest and dryer and warmer than normal conditions across much of the southern tier. • Winter temperatures are warmer than normal in the Southeast and cooler than normal in the Northwest.
La Nina Effects on US and California Strong La Nina
La Nina Effects on US and California Strong La Nina Weak to Moderate La Nina
What If The Walker Circulation is Normal, and There is Neither El Nino or La Nina?
What If The Walker Circulation is Normal, and There is Neither El Nino or La Nina? • We have a La Nada
NOAA Operational Definitions for El Niño and La Niña El Niño: characterized by a positive ONI greater than or equal to +0.5°C. La Nina: characterized by a negative ONI less than or equal to -0.5°C. To be classified as a full-fledged El Niño or La Niña episode these thresholds must be exceeded for a period of at least 5 consecutive months. Operational Nino Index (ONI) is based on oceanic temperature conditions in Nino Zone 3.4
Measuring ENSO using SST • The widely used Oceanic Nino Index (ONI) (below) classifies ENSO events according to SST trends (see chart below for 1950-2007 ONI, negative ONI = La Nina)
Measuring ENSO: More than SST • Some meteorologists use a multivariate approach to defining El Nino and La Nina • Multivariate ENSO Index (MEI) is based on the six main observed variables over the tropical Pacific: sea-level pressure , zonal (east/west) and meridional (north/south) components of the surface wind, sea surface temperature (SST), surface air temperature, and total cloudiness fraction of the sky.
Where Are We Now Where are we now?? • Average sea surface temperature (SST) anomalies (°C) for the four-week period 5 October - 1 November 2008. Anomalies are computed with respect to the 1971-2000 base period weekly means Average sea surface temperature (SST) anomalies (°C) for the four-week period 5 October - 1 November 2008. Anomalies are computed with respect to the 1971-2000 base period weekly means
‘Nino’ Zones 12 Month SST Trend ‘Nino’ Zones
. • . .
SST Forecasts SST Forecasts 2008-2009 SST Temperature Forecasts
Summary • ENSO-neutral conditions are present in the equatorial Pacific Ocean. • Equatorial SST anomalies were near-average across much of the Pacific Ocean, with small areas of negative SST anomalies present in parts of the eastern Pacific. • Based on recent SST trends and model forecasts, ENSO-neutral conditions are expected to continue into early 2009.