Download
1 / 36
360 likes | 481 Views
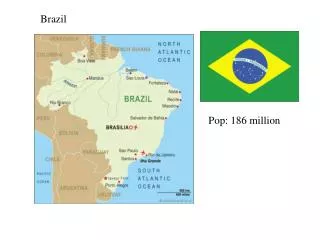
Social Policies in Brazil. Rômulo Paes de Sousa Executive Secretary Deputy Ministry of Social Development and Fight against Hunger of Brazil. New School - New York - February 23rd, 2010. Brazil. Population: 186.5 million 5 regions Area: 8,514,215.3 km²

E N D
Social Policies in Brazil Rômulo Paes de Sousa ExecutiveSecretaryDeputy Ministry of Social Development and FightagainstHunger of Brazil NewSchool- New York - February 23rd, 2010.
Brazil • Population: 186.5 million • 5 regions • Area: 8,514,215.3 km² • 26 States and a Federal District • 5,564 municipalities • Poor families: 11.1 million families • Extremely poor families: 4.5 million families Source: Ministry of Social Development and the Fight Against Hunger
PovertyandInequalityReduction • 19,4 million Brazilians have overcome extreme poverty since 2003. • Brazil achieved Target 1 of MDG ten years in advance and has set higher standards: reduce extreme poverty to ¼ and eradicate hunger until 2015. • Decrease of Inequality: from 2001 to 2008, the income of the bottom 10% grew six times faster than the top 10%.
Per capita household income distribution according to the Gini Index: Brazil, 1995 to 2008
Temporal evolution of extreme poverty Brazil, 1990 to 2008
Per capita household income distribution – Gini Index in Brazil, Mexico, USA, Canada and UK (1976 – 2008)
Economic Relevance of Social Transfers In 2009, the BPC and Bolsa Família cash transfers to poor families comprised approximately US$ 17 billion - around 1% of GDP. Redistributive effect: the smaller the per capita income of a given region, the bigger the importance of transfers for the local economy. In the Northeast (poorest region of Brazil), they represent 3% of regional GDP. As these social transfers raise the consumption capacity of families, they have an immediate multiplying effect on the economy.
Consolidation of Social Development Policies in Brazil to Eradicate Hunger, Reduce Poverty and Other Social Vulnerabilities
Social Protection Network Education Sports Social Security Labor Agricultural Development Health Culture Human rights Housing 11
New Social Agenda • The Ministry of Social Development and Fight Against Hunger (MDS) is part of a new social agenda that integrates all social programs by encompassing the following policies : • Nutrition and Food Security; • Social Protection and Assistance; • Conditioned Cash Transfer (CCT); • ProductiveInclusioninitiatives.
Budget Evolutionof MDS – from 2004 to 2009 1 real ~ 1.87 dollars
Social Management • Institutionalization of social assistance (Unified Social Assistance System – SUAS) as a Constitutional right, with the provision of non-contributive services and benefits. • Consolidation of CadUnico, a databank of elligible families according to social criteria. • Initiatives in municipalities to formalize minimum income schemes.
Performance of Policies, Programs and Actions Pillars of MDS social actions: Fight against hunger and malnutrition Reduction of poverty and inequality Enlargement of the social protection network
Bolsa Familia Program • Conditioned cash transfer program, launched in October 2003, and instituted by Federal Law; • Strategic axis for the integration of policies and actions within the Brazilian Social Protection and Promotion Network; • Benefits families with per capita income below US$ 80. • 12.4 million poor families (almost 50 million people) benefited in all 5,564 Brazilian municipalities; • Amount per family: varies from US$ 13 to US$ 114, depending on its size and poverty level. • Average amount: US$ 54 per family • Budget for 2009: US$ 10.5 billion (0.4% of the GDP);
Evolution: numberoffamiliesbenefitedby Bolsa Familia Brazil; 2004 to 2009 (in millions) Budget in 2009: US$ 6,74 billion
Conditionalities • Responsibility shared among the families and the State; • Reinforcement of Rights (education, health, social assistance); • Non-compliance with conditionalities is interpreted by federal and local authorities as a sign that a family may be at risk or in need of additional social assistance services; • The consequences for non-compliance with conditionalities are gradual, beginning with a “warning” followed by blockage, suspension, and finally cancellation of benefits.
Continuous Cash Benefit (BPC) • Introduced by the Federal Constitution of 1988; • Non-contributive; • Monthly minimum wage benefits (US$ 265) for the elderly (over 65) and persons with disabilities, unable to work, andbelonging to families with a monthly per capita income lower than ¼ of the minimum wage (US$ 66); • About 1.8 million persons with disabilities and 1.6 million elderly persons receive this benefit; • BPC budget for 2009 was 10.5 billion (0,6% of GDP).
Infant mortality and its components: precocious and late neonatal and post-neonatal. Brazil, 1996 – 2007.
Height-for-age distribution of children studied by each of four surveys versus the height-for-age distribution predicted by the WHO Child Growth Standard, 1975–2007 (Monteiro et al, 2009)
Percentage of children (0 to 4 years old) with inadequate weight-for-age, Brazil – 1996 to 2006 Fuente: Brasil. Ministério da Saúde. Pesquisa Nacional de Demografia e Saúde da Criança e da Mulher – PNDS 2006: dimensões do processo reprodutivo e da saúde da criança/ Ministério da Saúde, Centro Brasileiro de Análise e Planejamento. – Brasília: Ministério da Saúde, 2009. p.226
Impact of Bolsa Família Transfers on the reduction of inequity and poverty between 2003 and 2008 Source: Barros, R.P., on PNAD 2009, IPEA, 2009.
Per capita income before and after Conditioned Cash Transfers – Bolsa Familia, Brazil Source: Microdata from Cadastro Único Sept./2009 – MDS/SENARC.
The cash transfer programs have contributed to the reduction of poverty and inequality in the country • Bolsa Família : Fulfillment of service goals • 2003: 1.2 million families serviced • 2008: 10.5 million families serviced • Expansion of services of Continued Cash Benefits (BPC): • 2003: 1.7 million beneficiaries • 2008: 2.9 million beneficiaries
Coverage of Bolsa Família (%), Brazil, October-2003 x January-2009 1.2 million beneficiary families Source: MDS/SAGI e IPEA, Nota: (1) Coverage = Number of families benefited in Oct/2003, divided by the estimated number of poor families
CRAS: Social Assistance Reference Center CREAS: Social Assistance Specialized Reference Center
Challenges • Combination of economic growth, income distribution and social inclusion should be maintained for several years in order to achieve desirable standards of social development. • Despite recent advances in Brazil,the number of poverty-stricken people is still high (around 30 million). • Inequality rates continue among the highest in the world (Gini 0,531 in 2009). • persistence of illiteracy and unsatisfactory health indicators (mainly in the poorest regions such as Northeast).
Challenges Unified Registry System for Federal Government Social Programs: adequate access to water supply, garbage collection and disposal, in all types of residence and in urban residences only, by region, in September 2009 Source: Microdata from Cadastro Único, Sept./2009 – MDS/SENARC.
Challenges Spatial distribution of urban residences served by both water supply and garbage collection public systems, as well as adequate sanitation systems(septic or public network), in September 2009 Fonte: Microdados do Cadastro Único de Set./2009 – MDS/SENARC.
Obrigado! romulo.paes@mds.gov.br www.mds.gov.br www.fomezero.gov.br + 55 (61) 3433-1081