Download
1 / 13

E N D
State of the Markets ReportFederal Energy Regulatory Commission Office of Market Oversight and InvestigationsJune 15, 2005 Open Commission Meeting Item No.: A-3 Disclaimer: This Report contains analyses, presentations and conclusions that may be based on or derived from the data sources cited, but do not necessarily reflect the positions or recommendations of the data providers.
State of the Markets Report examines energy market activity in 2004 • Organized like an almanac with focus on regional electric and gas markets • Essays on issues of interest • Overviews of U.S. electric and gas markets • Profiles of other factors
Connections among U.S. energy and related markets tightened in 2004.
Average electric prices increased in almost all regions Electri0c Regions with Pricing Nodes On-Peak Prices ($/MWh) Source: Derived from Platts Megawatt Daily and Dow Jones data.
Electric prices driven by spot input prices • Where gas tends to be on the margin, electric prices increased by 5–12%. • Where eastern coal tends to be on the margin, on-peak prices rose 11–19% with off-peak prices as much as 33% higher. • Where western coal tends to be on the margin, on-peak electric prices increased less than 6%. Source: Graph derived from Platts and Bloomberg data.
Natural gas prices increased in all regions 2004 Locational Gas Prices ($/MMBtu) Source: Derived from Platts and GASdat data.
2004 gas prices driven by oil prices • Oil prices up 33% in 2004. • Gas prices maintained a fairly constant relationship to oil prices. • Storage levels remained healthy so no scarcity effects. Source: Graph derived from Platts and EIA data.
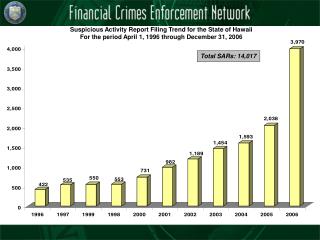
Gas and electric prices spiked on tight supply Energy markets under simultaneous stress: New England and record cold • January 15-16, 2004: coldest successive 2-day period in Boston since 1943. • Simultaneous stresses on both electric and natural gas systems, largely met. • Small amounts of gas moved in spot market at record prices to serve heating load. • High prices driven by scarcity; no indication of market manipulation or withholding. Source: Derived from ISO-NE morning reports Jan 14-16, 2004 and LDC data. .
Financial trading and investment activity grew in energy markets in 2004 • “Nontraditional” buyers acquired equity in almost 30 GW (about 5%) of U.S. generation in 2004. • Electric financial trading rose by a factor of 10 on ICE. • In gas, spreading open interest more than doubled. • Credit clearing grew. Source: Graph derived ICE on-peak financial swap volumes. ICE products evaluated include monthly, dual monthly, quarterly, and calendar year contracts traded for 2004.
Markets provided mixed incentives for investment • Electric generation markets are overbuilt as a whole. • Electric prices in constrained regions tended not to be high enough to justify investment. • Electric transmission investment increased for the fourth year in a row, up 69% since 2001 (though added only 931 circuit miles of high-voltage lines).
Based on 2004 experience, what electric issues appear most important? • How will electric markets respond to extreme stresses, weather or other incidents? • How will RTO markets adapt to regions that have a history of many separate control areas, such as MISO? • Can markets signal the need to build capacity far enough in advance to prevent shortages? • Can electric market institutions foster the development of more price responsive demand? • How will the industry integrate market institutions and reliability requirements?
Based on 2004 experience, what gas issues appear most important? • How will gas markets respond to extreme stresses, weather or other incidents? • Will innovations help improve natural gas supplies? • How will global markets for natural gas develop?
Acknowledgements • Eric Primosch • Astrid Rapp • Steve Reich • Thomas Rieley • Jeff Sanders • Manali Shah • Sebastian Tiger • Julia Tuzun • Rahul Varma • Carol White • Charles Whitmore • Dean Wight • Lance Hinrichs • John Jennrich • Ken Kohut • John Kroeger • Gary Mahrenholz • Kamaria Martin • Rafael Martinez • Cecily Marx • William Meroney • Steven Michaels • Kara Mucha • Christopher Peterson • Thomas Pinkston • Stacy Angel • Terry Bazemore • William Booth • Keith Collins • John Currie • Judy Eastwood • Charles Faust • Robert Flanders • Marie France • Ted Gerarden • Sidney Givens • Stephen Harvey • Alan Haymes