Download
1 / 29
290 likes | 386 Views
Update on West Nile Virus – United States, 1999-2006. Blood Products Advisory Committee 89 th Meeting April 27, 2007. Eileen C. Farnon, MD Arboviral Diseases Branch Division of Vector-Borne Infectious Diseases Centers for Disease Control and Prevention Fort Collins, Colorado. Epidemic.

E N D
Update on West Nile Virus – United States, 1999-2006 Blood Products Advisory Committee 89th Meeting April 27, 2007 Eileen C. Farnon, MD Arboviral Diseases Branch Division of Vector-Borne Infectious Diseases Centers for Disease Control and Prevention Fort Collins, Colorado
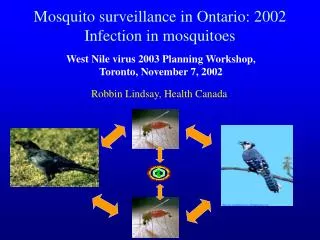
Epidemic Dead-end hosts (usually) Epizootic WNV Transmission Cycle Enzootic (Maintenance/Amplification) Amplifying hosts
ArboNET • Arboviral national electronic surveillance system • Humans • Ecologic • Mosquitoes • Birds • Animals • WNV, SLE, EEE, WEE, LAC, DEN, VEE • All data current as of April 12, 2007
Human WNV Syndromes Reported to ArboNET • WN fever (WNF) • WN neuroinvasive disease (WNND) • Meningitis • Encephalitis • Acute flaccid paralysis • Other • Unspecified illness
Incidence per million .01-9.99 Any WNV Activity 10-99.99 >=100 WNV Neuroinvasive Disease Incidence, by County, US, 1999 N=59
Incidence per million .01-9.99 Any WNV Activity 10-99.99 >=100 WNV Neuroinvasive Disease Incidence, by County, US, 2000 N=19
Incidence per million .01-9.99 Any WNV Activity 10-99.99 >=100 WNV Neuroinvasive Disease Incidence, by County, US, 2001 N=64
Incidence per million .01-9.99 Any WNV Activity 10-99.99 >=100 WNV Neuroinvasive Disease Incidence, by County, US, 2002 N=2,946
Incidence per million .01-9.99 Any WNV Activity 10-99.99 >=100 WNV Neuroinvasive Disease Incidence, by County, US, 2003 N=2,866
Incidence per million .01-9.99 Any WNV Activity 10-99.99 >=100 WNV Neuroinvasive Disease Incidence, by County, US, 2004 N=1,148
Incidence per million .01-9.99 Any WNV Activity 10-99.99 >=100 WNV Neuroinvasive Disease Incidence, by County, US, 2005 N=1,309
Incidence per million .01-9.99 Any WNV Activity 10-99.99 >=100 WNV Neuroinvasive Disease Incidence, by County, US, 2006 N=1,491 *Reported as of 4/12/2007
Onset of Human WNV Disease, United States 1999-2006* *Reported as of 4/12/2006
Cumulative WNND Incidence, by County, US, 2002-2006 *Reported as of 11/14/06 Lindsey N, et al, in press
Median Annual WNND Incidence Rank versus Cumulative WNND Incidence Rank by County, 2002-2006 *Reported as of 11/14/06 Lindsey N, et al, in press
Reported WNV Disease Cases in Humans – United States, 1999-2006* *Reported as of 4/12/2007
WNV Blood Screening • 2002 – 23 cases of transfusion-associated transmission (TAT) • 2003 – Nucleic acid amplification tests (NAT) • MP-NAT (6-16 units) ID-NAT • Blood banks report presumptively viremic donors (PVDs) to local public health department • Remove infectious blood products from circulation • Public health departments report to ArboNET • Perform clinical follow-up • Perform trace-back investigations
WNV PVDs by Year* *Reported as of 4/12/2007
West Nile Viremic Blood Donors, by State of Residence, 2006* *Reported as of 4/12/2007
PVDs Reported to ArboNET*, 2006 • Over 8 million donations screened • 361 PVDs reported to ArboNET • 84 (23%) WNF • 4 (0.1%) WNND • 2 (0.1%) other • 118 (33%) reported from 3 states: NE, ID, TX *Reported as of 4/12/2007
WNV Transfusion-associated Transmission, 2006 – Case 1 • 82 y male resident of SD recently post-kidney transplant • 4d post-transplant: 2U PRBC • 21d post-transplant: encephalitis • WNV IgM detected in serum and CSF • Organ donor tested negative for WNV • Blood donor tested positive for WNV IgM • negative MP-NAT MMWR 2/2/07
WNV Transfusion-associated Transmission, 2006 – Case 2 • 60 y male resident of IA 5y post-kidney transplant • Spinal fracture repair in SD: 15 blood products • 6U FFP from blood donor • 11d post-operatively: encephalomyelitis • WNV IgM detected in CSF MMWR 2/2/07
Summary • WNV occurs throughout the continental U.S. • Western plains have highest incidence of WNND • Dates of onset for WNV disease span the year • 2 cases of transfusion-associated transmission despite MP-NAT testing • New approaches to triggering ID-NAT considered
Jennifer Lehman Nicole Lindsey Stephanie Kuhn Margaret Collins Kate Ellingson Matt Kuehnert Mark Duffy Marc Fischer Edward Hayes John Jones Nicholas Komar Roger Nasci John Roehrig Janet McAllister Harry Savage James Sejvar Theresa Smith Grant Campbell Brad Biggerstaff Lyle Petersen All reporting states, jurisdictions, and local health departments Acknowledgements The findings and conclusions in this presentation are those of the authors and do not necessarily represent the views of the Centers for Disease Control and Prevention.
Cumulative Incidence of WNND by State – United States, 2002-2006* *Reported as of 11/14/06