Download

1 / 14
150 likes | 184 Views
CropScape is a web service that provides a user-friendly map visualization and querying system for U.S. croplands, aiming to minimize crop loss in a changing climate. It offers equitable information access, automatic timely delivery, and geospatial navigation.

E N D
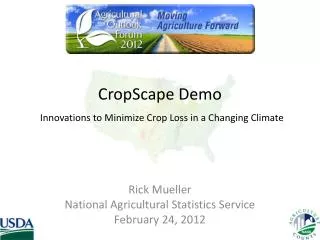
CropScape DemoInnovations to Minimize Crop Loss in a Changing Climate Rick Mueller National Agricultural Statistics Service February 24, 2012
CropScape • A web service based interactive map visualization, dissemination and querying system for U.S. cropland • No burden on users • No client software development & installation • No special software tools needed • Data mashable • Democratization of data • Equitable information access, automatic timely delivery, and geospatial navigation • Collaboration with George Mason University/Center for Spatial Information Science and Systems (CSISS) http://nassgeodata.gmu.edu/CropScape
2008 – 2011 National Cropland Data Layers ~ 9 billion pixels/year! Harmonize ALL historical CDL products to standard: color scheme, categories, projection, metadata.
1997 – 2007 Cropland Data Layers ’06-’07 ’07 ’97-’07 ’06-’07 ’07 ’05 & ’07 ’03-’07 ’06-‘07 ’02 ’07 ’02 ’02 ’00-’07 ’01-’07 ’06-’07 ’99-’07 ’02 ’00-’07 ’02 ’02 ’02 ’06-’07 ’01-’07 ’07 ’02 ’06-07 ’97-’07 ’99-’07 ’04-’07 ’04 Harmonize ALL historical CDL products to standard: color scheme, categories, projection, metadata.
CropScape Components Data View Pixel Query Stats/Change Navigation Help AOI Query Print/Download Overview Social Media
Select an Area of Interest By State By State & ASD
Select an Area of Interest By State, District & County By Rectangle, Circle, or Polygon
Crop Statistics Pixel counting is usually downward biased when compared to official estimates. Counting pixels and multiplying by the area of each pixel will result in biased area estimates and should be considered raw numbers needing bias correction. Official crop acreage estimates are available at http://www.nass.usda.gov/.
Change Analysis 2010 2009
NASS Cropland Data Layer Applications Climate Acreage Estimates Modeling Irrigation Epidemiology Land Cover Soil Utilization Research Agribusiness Pest Control Ethanol Carbon Forest Biodiesel Pesticides Erosion Fertilizer Ecology Yield Biofuel Land Use CRP http://nassgeodata.gmu.edu/CropScape Ecosystem Commodity Planning Urban Growth Soil and Water Water Use Fertilizer Usage Crop Rotation Crop Intensity Land Management Environmental Risk Wildlife Habitat Water Quality Watersheds Education Change Detection Mapping Transportation Data Mining Condition Assessment Disaster Assessment Crop Protection Crop Production