Download
1 / 43
430 likes | 550 Views
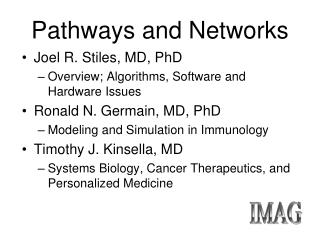
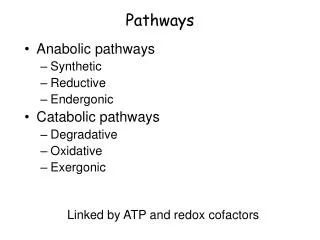
Pathways and Diseases. Purvesh Khatri February 25, 2009 BMI 217 Translational Bioinformatics. History. Gene -> Genome -> Microarray. High throughput sequencing. Lectures 6 - Gene expression analysis. Lecture 3 – genomes. What does a microarray experiment tell us?.

E N D
Pathways and Diseases Purvesh Khatri February 25, 2009 BMI 217 Translational Bioinformatics
History • Gene -> Genome -> Microarray High throughput sequencing Lectures 6 - Gene expression analysis Lecture 3 – genomes
What does a microarray experiment tell us? • A list differentially expressed genes in the condition under study. What can we say about this list?
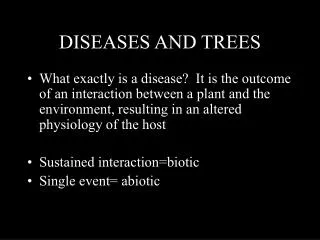
What does a microarray experiment not tell us? • A microarray experiment only provides a list of differentially expressed genes. • Experiment has only begun! • A microarray experiment does not explain underlying biology. • The most important challenge presented by a microarray experiment is extracting the biology in the condition under study from a list of differentially expressed genes.
So…how do we extract biology? • Search the literature • Search public databases • PubMed • Gene annotation databases (e.g., Entrez Gene) • Diesease databases (e.g., OMIM) • so on..
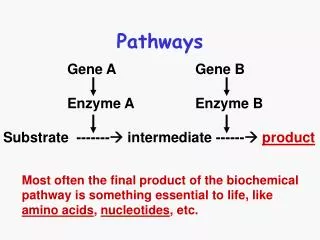
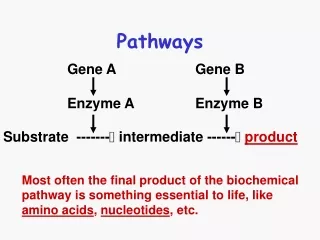
Literature search – first pass Gene 1 Apoptosis Cell-cell signaling Protein phosphorylation Mitosis … Gene 2 Growth control Mitosis Oncogenesis Protein phosphorylation … Gene 3 Growth control Mitosis Oncogenesis Protein phosphorylation … Gene 4 Nervous system Pregnancy Oncogenesis Mitosis … Gene 100 Positive ctrl. of cell prolif Mitosis Oncogenesis Glucose transport …
Literature search – second pass Glucose transport Gene 7 Gene 3 Gene 6 … Apoptosis Gene 1 Gene 53 Mitosis Gene 2 Gene 5 Gene45 Gene 7 Gene 35 … Positive ctrl. of cell prolif. Gene 7 Gene 3 Gene 12 … Oncogenesis Gene 5 Gene 2 Gene 6 …
What is wrong with this picture? • Problems • Very slow • Error prone • Inconsistent naming conventions • Unable to provide logical reasoning • We need an ontology
What is Gene Ontology? • Dynamic, structured, precisely defined, common, controlled vocabulary. • Ashburner et al. Nature Genetics, 2000;25(1):25-29 • Three axes of annotation • Biological processes • Biological objective of a gene • Molecular functions • Biochemical activity performed to achieve its objective • Cellular components • Location of biochemical activity • www.geneontology.org
GOToolBox OntologyTraverser CLENCH GOTree Machine GeneMerge GoMiner Onto-Express APR DEC MAR DEC JUN FEB MAY NOV OCT MAR MAY 2001 2002 2003 2004 2005 DAVID, EASEonline FuncAssociate FatiGO GOstat GoSurfer, eGOn GO::TermFinder Functional Profiling using GO • Large number of tools have been developed
Data mining results – first shot Microarray (1000 genes) Data Analysis Reg. genes (100 genes) Exp. GO tool mitosis – 80/100 oncogenesis – 40/100 p. ctrl. cell prol. – 30/100 glucose transp. – 20/100 Now can we say something about these genes? Hypothesis: Cancer?
Functional representation on the array Occurred vs. expected What will be our hypothesis now? Hypothesis: diabetes?
The problem • We expected 5 genes in glucose transport and we got 20. This is 4 times more than expected but it can still happen just by chance!!! • What if we had 10 times more than expected. It can still happen just by chance but the probability of this happening is much lower. • Question: what is the probability of obtaining the observed result just by chance? • Can we calculate a confidence value associated with each category?
Confidence value • Hypergeometric distribution: • Binomial distribution:
Limitations of GO analysis • Does not consider expression from microarrays • Single-gene analysis may miss important effects on pathways. • Cellular processes often affect set of genes acting in concert. • Increase of 20% in all genes in a given pathway can be more significant than 20-fold increase in a single gene on the same pathway.
Gene Set Enrichment Analysis • Considers the distribution of the pathway genes in the entire list of genes • Ranks all genes based on the correlation between their expression and the given phenotypes • Calculates a score that reflects the degree to which a given pathway P is represented at the extremes of the entire ranked list. • The score is calculated by walking down the list of genes ordered by expression change. • The score is increased for every gene that belongs to P and decreased for every gene that does not. • Statistical signicance is established with respect to a null distribution constructed by permuting the class labels.
Limitations – Relative enrichment • Ratio of proportions in sample and population. • Any relative enrichment value can occur just by chance. Hence, it is not informative as to the significance of the observed event • Does not consider dependencies between genes and/or between pathways Occurred vs. expected
Limitations – Statistical Models • Does not consider measured change in expression • Calculate a statistical significance value (p value) • Assumes genes are independent • Takes into consideration only the number of genes (k differentially expressed genes on a given pathway will yield the same p-value no matter which genes are differentially expressed)
Limitations – Resampling-based methods • Signicifance Analysis of Function Enrichment (SAFE) • SAM-like analysis (Barry et al., Bioinformatics 2005) • Calculates a statistical significance • Considers dependencies between genes • Are still oblivious to the semantic content of the pathways • Does not consider the semantic content of the pathways (their topology, the interactions described within, etc.)
Limitations - GSEA • Calculates significance • Considers dependencies between genes • Considers measured changes in gene expression • Does not consider the topology • Does not consider the different types of interactions between genes
Insulin Signaling Pathway (KEGG) http://www.genome.jp/kegg/pathway/hsa/hsa04910.html
Cholesterol Syntehsis • Statin reduces blood cholesterol levels • Lipitor • Inhibits HMG CoA reductase
What do we want to do? • We would like to integrate established statistical analysis with pathway specific information • Type of interaction • Position in a pathway
Pathway Impact Factor • A pathway should be important in a manner directly proportional to the number of differentially expressed genes in it (everything else is similar) Condition B Condition A
Pathway Impact Factor • A pathway will be impacted in a manner that is inversely proportional to the total number of genes in it
Pathway Impact Factor • A change in the expression of a gene downstream on the pathway perturbs the pathway less than a change in the expression of a gene upstream
u g Pathway Impact Factor • A change in the expression of a gene whose product is shared among several downstream genes will be divided among those genes
How do we use this information? • A pathway will be impacted in a manner directly proportional to the number of differentially regulated genes in it (everything else is similar) • P1 and P2 have 10 genes, P1 has 3 differentially expressed genes, P2 has 8 • A pathway will be impacted in a manner that is inversely proportional to the total number of genes in it • P1 and P2 have 5 differentially regulated genes, P1 has 10 genes, P2 has 50 • A change in the expression of a gene downstream on the pathway perturbs the pathway less than a change in the expression of a gene upstream • A change in the expression of a gene whose product is shared among several downstream genes will be divided among those genes • Certain types of the differentially expressed genes/protein (e.g. transcription factors) will have a greater impact on certain pathways.
Results – Breast Cancer • Breast cancer - van't Veer et al. Gene expression profiling predicts clinical outcome of breast cancer. Nature 415 (2002) 530-536 - 231 genes found to be differentially regulated • In the results below green pathways are highly relevant to the condition while the red pathways are unrelated to the condition Hypergeometric GSEA Impact analysis
Relevant pathways in breast cancer • Cell cycle • No further discussion • Focal adhesion • FAK has been found to contribute to cellular adhesion and survival pathways in breast cancer cells which are not required for survival in non-malignant breast epithelial cell • Beviglia, L, Golubovskaya, V, Xu, L, Yang, X, Craven, R. J, & Cance, W. G. (2003) Biochem J 373, 201–10. • Doxorubicin, caused the formation of well defined focal adhesions and stress fibers in mammary adenocarcinoma MTLn3 cells early after treatment • The FAK/PI-3 Kinase/PKB signaling route has been proposed as the mechanism through which Doxorubicin triggers the onset of apoptosis • van Nimwegen, M. J, Huigsloot, M, Camier, A, Tijdens, I. B, & van de Water, B. (2006) Mol Pharmacol70, 1330–9. • TGF-beta signaling • TGF-beta1 is known as marker of invasiveness and metastatic capacity of breast cancer cells • Todorovic-Rakovic, N. (2005) Med Hypotheses 65, 546–51. • Plasma levels of TGF-beta1 have been used to identify low-risk postmenopausal metastatic breast cancer patients • Nikolic-Vukosavljevic, D, Todorovic-Rakovic, N, Demajo, M, Ivanovic, V, Neskovic, B, Markicevic, M, & Neskovic-Konstantinovic, Z. (2004) Clin Exp Metastasis 21, 581– • MAPK • Connected to cancer in general and breast cancer in particular • The proliferative response to progestin and estrogen was shown to be inhibited in mamary cells microinjected with inhibitors of MAP kinase pathway • Chen, Z, Gibson, T. B, Robinson, F, Silvestro, L, Pearson, G, e Xu, B, Wright, A, Vanderbilt, C, & Cobb, M. H. (2001) Chemical Reviews 101, 2449–2476.
ScorePage • Extends GSEA by integrating topology information. • It also considers distance between each pair of enzymes in a pathway • Suitable only for metaboloic pathways. • Distance is computed as the number of reactions needed to convert from one enzyme to the other.
How far are we? • Current pathway knowledge is only described at gene or protein levels. • No information about alternatively spliced transcripts and their roles in different pathways. • Context specific information is missing • Current pathway knowledge is mostly about normal condition. • Gene interactions might be changing under disease condition. • Different pathways are active at different time • Cell, tissue, age, gender
How far are we? • GO and PPI describe proteins; GSEA captures RNA information • What about RNAi? • Integration of information obtained from CHIP-chip assays • Weak links within and between pathways
Thank you! pkhatri@stanford.edu
Need for Gene Ontology • Literature search must be expanded to all organisms. • Limited set of genes and proteins that is conserved in most or all living cells. • Knowledge of role of such a shared gene in one organism can automatically be transferred to another organism.
Limitations of GO and GSEA • GO – only considers number of genes • GSEA – considers number of genes and their expression. • Do not consider • Which genes interact with each other • Type of interaction • Position of genes in a pathway