Download
1 / 27
270 likes | 438 Views
Black Oak- White Oak Forest. Manistee National Forest. * Outwash plain dominated by Jack Pine to the west * Northern hardwood forest to the east. Land Form. Kamic Hills Formed by Wisconsin Glaciation approx. 8000-9000 years ago. Parent Material.

E N D
Manistee National Forest * Outwash plain dominated by Jack Pine to the west * Northern hardwood forest to the east
Land Form • Kamic Hills • Formed by • Wisconsin • Glaciation approx. • 8000-9000 years • ago
Parent Material • Ice contact material • Derived from outwash • stratified drift laid down • by previous Illinoian • glaciation (128,000 yrs. • ago)
Soil Profile Oe/i/a2-0 cm; intact and partially decomposed Quercus rubra, Acer rubrum, Q. alba leaves; abrupt smooth boundary. A 0-3 cm; black (7.5 YR 2.5/1) loamy sand, weak fine subangular blocky structure; very strongly acid; abrupt smooth boundary. E 3-6 cm; dark gray (7.5YR 4/1) loamy sand; weak medium subangular blocky structure; very strongly acid:, abrupt smooth boundary. BS1 6-14 cm; brown. (7.5YR 4/4) sand; single grain; moderately acid; diffuse smooth boundary. BS2 14-26 cm; strong brown (7.5YR 5/8) sand; single grain; moderately acid; diffuse smooth boundary. C 26 cm; dark yellowish brown (10YR 5/8) sand; single grain; moderately acid.
Bulk Density, AWC and OM • Bulk Density: • 1.08 g/cm3 • Available Water Content: • 0.23 cm3 H2O/ cm3 soil • Organic Matter Content: • 2.06 %
Soil pH, CEC & base saturation % Base Saturation 13% pH Using H2O: 4.62 Using CaCl2:3.46 CEC (cmolc/ kg) 1.19
Soil Profile Summary • Soil Texture: Sand (76-91%) • Silt (3-17%) • Clay (3-5%) • - Affects Db and AWC • Lowest CEC and base saturation • Non-calcareous; acidic • Soil horizons shallow and not well • developed
Soil Profile Summary • Texture= Sand(90-92%) Clay (3.5%) & Silt ( 5-5.5%)* Non-calcareous; Acidic* Well-developed forest floor* Soil Horizons shallow & not very developed
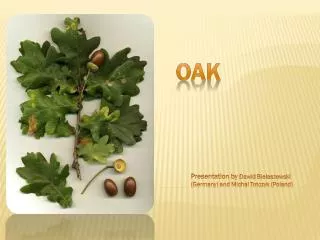
Plant Profile Predominant Overstory plantsQuercus alba, Quercus rubra, Acer rubrumUnderstory plants includedPinus Strobus, Sassafras albidum, Hamamelis virginianaGroundcover plants included Pteridium aquilinum, Carex Pensylvanica, Gaylussacia bacata
Plant Factors Influencing Soil • Slow Decomposition • Nutrient Poor Litter • High Content of Organic Acids
Nitrogen Exchange • Nitrogen is often a limiting factor in the productivity of terrestrial ecosystems. • Microbial activity fixes organic nitrogen into forms that are available to plants • plants use fixed nitrogen to manufacture organic compounds, • N returns to the microbes tied in organic compounds forming plant litter
Nitrogen Exchange N cycling is controlled by: • Litter production, above and below ground • Litter chemical composition • Microbial community numbers and types • Temperature and moisture affecting the activity of microorganisms
Role of Organic Matter (Carbon) • Carbon supplied by plant litter limits microbial growth • Amount of N released during decomposition reflects the “quality” of organic matter
The Connection Plant and microbial activity within terrestrial ecosystems is tightly linked through the exchange of C and N
Chemistry • N is released from OM by heterotrophic soil organisms (bacteria,fungi, actinomycetes) in the form of ammonia • R-NH3 + H2O R-OH + NH4+ • Ammonia can then be assimilated by plants, participate in ion exchange reactions or…
Chemistry …it can be oxidized by chemoautotropic bacteria to form nitrate 2 steps: • NH4+ + 11/2 O2 NO2- + H2O + 2H+ • NO2- + 1/2O2 NO3-
Nitrifying Bacteria • Only 3 genera carry out the first step, and only 1 genera carry our the second • All nitrifying bacteria are • strictly anaerobic and • intolerent of low soil pH • Thus, their activity is restricted in acidic conditions like the northern oak ecosystem
N and C Exchange in the Northern Oak Ecosystem • Microbial biomass is very small • Thus, so is the specific microbial respiration rate, indicating the relative efficiency of the microbial community to convert organic C to biomass. (higher = less efficient)
N and C Exchange in the Northern Oak Ecosystem • The low biomass of microorganisms contributes to a small amount nitrogen produced. • The acidity of the site may contribute to the very low amount of nitrate.
N and C Exchange in the Northern Oak Ecosystem • The ratio of C respired to N mineralized indicates the litter quality of a site. • A high ratio indicates a good substrate for microbial growth, but little N released where it can be assimilated for plants.
How does it all fit together? • Fire from west burns through NO forest • burn quick release & loss of nutrients • Vegetation = response to /100yr disturbance • Less nutrients in oak litter slow decomp. • Canopy less dense site drier than NH • Less water less weathering of soil