Download

1 / 28
290 likes | 407 Views
“A RESEARCH STUDY TO ASSESS THE EFFECTIVENESS OF POLICIES DESIGNED TO MITIGATE THE IMPACT OF THE GLOBAL FINANCIAL CRISIS IN INDONESIA”. Djoni Hartono Faculty of Economics and Business Universitas Indonesia. Outline. Introduction Research Methodology Crisis Overview Employment Data

E N D
“A RESEARCH STUDY TO ASSESS THE EFFECTIVENESS OF POLICIES DESIGNED TO MITIGATE THE IMPACT OF THE GLOBAL FINANCIAL CRISIS IN INDONESIA” Djoni Hartono Faculty of Economics and Business Universitas Indonesia
Outline Introduction Research Methodology Crisis Overview Employment Data Simulation and Result Conclusion and Policy Implication
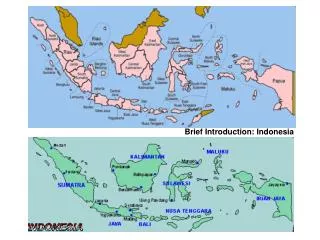
Indonesia and Economic Crisis IntroductionResearch MethodologyCrisis OverviewEmployment DataSimulation and ResultConclusion and Policy Implication Indonesia has been struggling with many economic crises: - hyperinflation crisis of 1965/1968 - Asian crisis of 1997/1998 - Global Financial Crisis 2008 The Asian 1997/1998 crisis caused the significant depreciation of the Indonesian IDR from approximately 2,450 per USD in June 1997 to 14,900 per USD in June 1998; Many firms went bankrupt and this created severe loss of employment in the formal sector; the inflation rate grew to 38 per cent in the first semester of 1998; 16 private banks were liquidated.
Indonesia and Economic Crisis IntroductionResearch MethodologyCrisis OverviewEmployment DataSimulation and ResultConclusion and Policy Implication The 2008 global financial crisis has not seriously affected Indonesia’s economy, largely due to the sizeable portion of GDP (65 per cent) that is attributed to domestic consumption. Indonesia still had positive economic growth (the Indonesian economy grew 6.1 per cent relative to previous year and then grew slower by 4.5 per cent in 2009 ) Despite the fact that the Indonesian economy still performed better than other countries, Indonesia’s export decreased due to lower demand particularly from other developed countries.
Indonesia and Economic Crisis IntroductionResearch MethodologyCrisis OverviewEmployment DataSimulation and ResultConclusion and Policy Implication The crisis also potentially threaten Indonesian labour market which dominated by informal sector. If the business collapse, many workers will be drawn to informal sector and increase the Indonesian informality rate. In order to cope with the possible threats of global economic crisis, Government of Indonesia (GoI) implemented a fiscal stimulus package to secure domestic economy. This report provides valuable analysis on the types of instruments that have best responded to the crisis and indicates the type of instruments that have had significant positive impacts on household and employment creation.
Dynamic Social Accounting Matrix (DySAM) IntroductionResearch MethodologyCrisis OverviewEmployment DataSimulation and ResultConclusion and Policy Implication The method that is primarily used to undertake the analysis is a dynamic social accounting matrix, which was developed to analyze the impact and cost-effectiveness of government investments. The DySAM for Indonesia is based on a static SAM from 2005, and it includes nine years of data, from 2000 to 2008. The model has been adapted and includes disaggregate information on the infrastructure sector into 4 sub sectors, namely labour intensive road construction, capital intensive road construction, irrigation and rest construction. The model also includes an employment satellite account to analyze the impact of exogenous injection on employment.
DySAM Framework IntroductionResearch MethodologyCrisis OverviewEmployment DataSimulation and ResultConclusion and Policy Implication
Indonesian Economic Performance and the 1997 Asian Financial Crisis IntroductionResearch MethodologyCrisis OverviewEmployment DataSimulation and ResultConclusion and Policy Implication In 1997 Indonesian output grew positively by 7.4 per cent in the first quartile, 6.1 per cent in the second quartile and 4.5 per cent in the third quartile. Then, in the fourth quartile, Indonesian output contracted by -0.9 per cent - mostly due to the collapse of the manufacturing sector. The condition became worse in the next period, which saw output drop significantly to -19.4 per cent in the fourth quartile 1998. The significant drop in growth was also accompanied by high inflation rate. Inflation rate increased up to the two digit level, amounting to 77.6 per cent in 1998. The unemployment rate in 1998 increased to 5.46 per cent from 4.68 per cent in 1997. Approximately 1.3 million of workers fell into unemployment due to contract termination in manufacturing sector. 678,000 workers in the construction sector, and 406,000 others in trade, hotel and restaurant sector .
Indonesian Economic Performance and the 2008 Global Financial Crisis IntroductionResearch MethodologyCrisis OverviewEmployment DataSimulation and ResultConclusion and Policy Implication Indonesian national output grew slower by 6.1 per cent in 2008 in comparison with 2007 levels. Mostly attributed to lower growth in the manufacturing sector. Indonesian exports deteriorated from 10.63 per cent in first quartile up to 1.99 per cent in fourth quartile. The inflation rate in 2008 was quite high, at approximately 11.06 per cent and mainly due to the increase of domestic oil prices and the price of world food crops. The unemployment rate decreased from 9.11 per cent to 8.39 per cent of total labour force. Two sectors that are quite dominant in creating new job are services sector and trade sector. Informal labour still dominant and even increased in August 2008 relative to August 2007. In 2008, number of labourers who were underemployed also increased gradually up to 31.1 million people in August 2008 or about 27.8 per cent from total labour force.
The Government of Indonesia’sResponse to the Global Financial Crisis IntroductionResearch MethodologyCrisis OverviewEmployment DataSimulation and ResultConclusion and Policy Implication • The GoI introduced a fiscal stimulus package to minimize the negative impact of the 2008 global economic crisis in March 2009. The policies in the package could be grouped into three programs, namely: 1. Maintain and improve people purchasing power; 2. Prevent employee’s contract termination and improvement on product competitiveness; 3. Increase investment in labour intensive infrastructure. • The total budget that are allocated for the fiscal stimulus amounted to 73.3 trillion IDR, which consists of 56.3 trillion IDR in terms of tax incentive (tax cut) and additional government budget as much as 17 trillion IDR.
LabourForceSurvey • versus • SAM Employment Data IntroductionResearch MethodologyCrisis OverviewEmployment DataSimulation and ResultConclusion and Policy Implication SAM-based employment data is adjusted LFS-based employment data that has been controlled by wage and salary account in IO table and wage statistics that are published by Central Agency of Statistics. the result would give a clear figure of employment condition that is in line with sectoral output and pattern of sectoral value added. SAM-based employment data also have weaknesses in which the employment data is not available yearly since it will in line with the publication of SAM Table (5 years period) LFS is a periodical datasets that can provide us with the most up-to-date labour data. The data is built based on survey on sample that is chosen by using some particular criteria. LFS-based employment data is a projection data that use weigh from IntercensalPopulation Survey.
Recommendations for estimation of employment for the DySAMemploymentsatelliteaccount IntroductionResearch MethodologyCrisis OverviewEmployment DataSimulation and ResultConclusion and Policy Implication • SAM-based employment data has been controlled by wage and salary account in IO Table and wage statistic. Therefore, employment data for DySAM employment satellite should be formulated by considering LFS data and then control by control variable which is done in SAM-based employment data. • In this study we propose another approach to formulate DySAM employment satellite. This approach consists of three steps, hence: 1. Re-estimate employment statistics by sector based on LFS data and then calculate yearly growth of employment in each sector. 2. Calculate number of labour in 2006 up to 2008 by using employment statistic in SAM Table 2005 and growth of employment which is resulted in (1). Number of employment in 2005 must be exactly the same with employment statistic in SAM Table 2005. 3. Control total number of labor in (2) with total number of labor in LFS for each year and each sector. Total number of labours that are used in this approach is based on LFS data in August. Labour is defined as worker who are 10 years old and above.
The Realization Rates of the Fiscal Stimulus IntroductionResearch MethodologyCrisis OverviewEmployment DataSimulation and ResultConclusion and Policy Implication The total realization rate of the fiscal stimulus was 83.84 per cent or equal to 61.4 trillion IDR. Based on its objective, the realization of fiscal stimulus consists of - 78.7 per cent realization of the first group of programs - 85 per cent realization of second group of programs, and - 91.4 per cent realization of third group of programs. The low realization of fiscal stimulus in the first group of fiscal stimulus instruments are largely contributed by the very low realization rates on value added tax cut along with personal income tax cut which amounted 61.35 per cent and 79.70 per cent respectively .
The Realization Rates of the Fiscal Stimulus IntroductionResearch MethodologyCrisis OverviewEmployment DataSimulation and ResultConclusion and Policy Implication In the second group of fiscal stimulus instruments, a relatively low realization rates was on tariff import tax cut, which was only less than half per cent. It was due to a relatively late implementation date. The instrument was only effective in the second semester 2009, which is late, especially as firms usually sign contracts on raw material buying in the beginning of the year. Factors that became barriers in the infrastructure program (3rd group of fiscal stimulus instruments) implementation were lack of supporting regulation, complicated administration and accounting process, tender process, and implementation process.
List of possible scenarios on DySAM analysis IntroductionResearch MethodologyCrisis OverviewEmployment DataSimulation and ResultConclusion and Policy Implication Eight scenarios are derived from the long list of fiscal stimulus budget (Ministry of Finance, 2009), hence: 1st Scenario : Reduction of personal income tax as much as 24.7 trillion IDR. The value is distributed proportionally to each household depend on their tax payment. 2nd Scenario : Reduction of corporate income tax by 19.3 trillion IDR. 3rd Scenario : Reduction of indirect tax as much as 1.8 trillion IDR on three commodities, namely: (i) food by 0.8 trillion IDR; (ii) chemical by 0.03 trillion IDR; and (iii) oil exploration by 1 trillion IDR. 4th Scenario : Reducing tariff import as much as 7.2 billion IDR on Paper, Print, Transp, Metal Commodity.
List of possible scenarios on DySAM analysis IntroductionResearch MethodologyCrisis OverviewEmployment DataSimulation and ResultConclusion and Policy Implication 5th Scenario : Subsidy as much as4.2 trillion IDR on 5 (five) activities, namely (i) Chemical, Fertilizer, Clay, Cement by 3.1 trillion IDR, (ii) Food by 82.7 billion IDR, (iii) Wood by 68.9 billion IDR, (iv) Weave, Textile, Garment, Leather by 0.34 trillion IDR, and (v) Paper, Print, Transp, Metal by 0.58 trillion IDR. 6th Scenario : Government transfer to Corporate as much as 0.5 trillion IDR 7th Scenario : Increase of government capital account as much as 10.9 trillion IDR on 5 (five) commodities namely: (i) Construction by 9.8 trillion IDR, (ii) Electricity, Gas and Water by 0.07 trillion IDR, (iii) Land Transportation by 0.17 trillion IDR, (iv) Government Services by 0.86 trillion IDR. 8th Scenario : Aggregate scenarios (overall fiscal stimulus policy)
The impact of each fiscal stimulus instrument on production activities IntroductionResearch MethodologyCrisis OverviewEmployment DataSimulation and ResultConclusion and Policy Implication Personal income tax reduction (scenario 1) will have larger impact on production activities in almost all sectors, except for the infrastructure sectors; The five sectors that will experience the highest impact are livestock, fishery, crops, restaurant and food, drink and tobacco sectors. Scenario 2 and scenario 6 are very similar in which enterprises are the main concern. The highest impact is expected to existed in crops sector, livestock sector, fishery sector, food, drink and tobacco sector, restaurant sector, bank, insurance and services sector and other individual and household services sector. A VAT reduction (scenario 3) on the food sector will not only have an impact on the food sector, but also on agricultural sectors except for forestry sector. Higher activities in the food sector will cause higher demand on input for the food sector.
The impact of each fiscal stimulus instrument on production activities IntroductionResearch MethodologyCrisis OverviewEmployment DataSimulation and ResultConclusion and Policy Implication In scenario 5, a subsidy on a particular sector will only have a moderate impact on the chemical sector and the textile sector and other agriculture. Moreover, it will only have a small impact on food sector and paper, print and other industry sector. In scenario 7, the impact on the production activities in all sector are quite significant, especially on road sector, irrigation sector, construction sector and electricity, gas and water sector. Higher activities in the construction sector increases the demand for raw materials, therefore, the scenario sees an also increase the production activities of the mining and query sector.
The impact of each fiscal stimulus instrument on production activities IntroductionResearch MethodologyCrisis OverviewEmployment DataSimulation and ResultConclusion and Policy Implication Agricultural sector seems to benefit moderately from any scenario and even received the highest impact if the fiscal stimulus policy is conducted through personal tax cut and corporate income tax cut. Manufacturing sector is expected to experienced highest impact if subsidy on activities is implemented. Interestingly, the impact of value added tax cut on manufacturing sector performance is expected not too significant in magnitude. The argument is mainly due to the size of the shock which is only 1.8 trillion IDR and mostly (about 1 trillion IDR) was distributed on Coal, Metal Petroleum Mining sector. Meanwhile, construction sector, road sector and irrigation sector is only benefit from fiscal stimulus policy on infrastructure.
The impact of each fiscal stimulus instrument on labour income IntroductionResearch MethodologyCrisis OverviewEmployment DataSimulation and ResultConclusion and Policy Implication Personal income tax reduction will have larger impact on agricultural workers, both formal and informal in urban and rural areas. Corporate tax reduction (Scenario 2) and subsidy (Scenario 5) are expected to increase labour income in all types of labour with the largest impact existed on agricultural worker both formal and informal in urban and rural areas. VAT reduction on particular sectors is expected to increase labour income at least 0.06 per cent for all agricultural worker both informal and formal in both urban and rural. Fiscal stimulus on infrastructure (Scenario 7) is expected to increase labour income for all types of labour ranging between 0.23 up to 0.42 per cent. Formal manual worker in rural areas are expected to receive the highest impact.
The impact of each fiscal stimulus instrument on household income IntroductionResearch MethodologyCrisis OverviewEmployment DataSimulation and ResultConclusion and Policy Implication In scenario 1, it is expected that household income to increase more than 0.9 per cent relative to the baseline. Groups of household that will benefit the most are the high income household both in urban and rural. Oppositely, agricultural employee will received the lowest impact due to personal tax cut policy. The impact of corporate tax cut (scenario 2) on household income is expected to increase income in all types of households with highest impact on larger farmer as much as 0.06 per cent. Value added tax reduction (scenario 3) is expected to increase income of all groups of households in which agricultural employee, and urban non labor, are expected to be positively affected less than others. The highest impact will be accepted by medium farmer, larger farmer and rural high income.
The impact of each fiscal stimulus instrument on household income IntroductionResearch MethodologyCrisis OverviewEmployment DataSimulation and ResultConclusion and Policy Implication In scenario 7, fiscal stimulus on infrastructure, is expected to result in a relatively prevalent impact on household income. Only agricultural employee have a smaller change in income - less than 0.2 per cent - since infrastructure jobs will involve many manual worker instead of agricultural workers. The results in all scenarios suggest that the benefit of fiscal stimulus policy will be bias to medium-high income household which is reflected on the types of household who received the highest impact. Even though the impact of fiscal stimulus is also positive for agriculture employee but its magnitude is the lowest among others. Two conditions above would cause a larger disparity of income between medium-high income household and agriculture employee, rural low income and urban low income.
The impact of each fiscal stimulus instrument on employment IntroductionResearch MethodologyCrisis OverviewEmployment DataSimulation and ResultConclusion and Policy Implication Personal income tax reduction is expected to create new jobs, as much as 0.75 million labour places. Most of the labour places (about 60 per cent) are located in the rural areas. In terms of sectors, the crops sector is expected to get the highest positive impact, since nearly 40 per cent of the new jobs are created in this sector. Corporate tax reduction is also expected to increase employment creation in a relatively smaller magnitude. In terms of location, the rural areas is expected to be more dominant than the urban areas. This is also the case for the rest of the scenarios except for in Scenario 4 in which sectors that are mostly affected are located in urban areas, for instance Textile and Leather sector.
The impact of each fiscal stimulus instrument on employment IntroductionResearch MethodologyCrisis OverviewEmployment DataSimulation and ResultConclusion and Policy Implication In Scenario 7 we can see that infrastructure stimulus will result more than 297,628 new jobs. The impact is much smaller than the scenario 1 which can create approximately 0.75 million labour places. Important to note here that budget that are spent in this scenario is only less than half of personal tax cut policy. Overall, the impact of fiscal stimulus on employment is biased to informal sector. These means that even though the unemployment rate decrease but this improvement is largely determined by the performance of informal sector. In terms of occupation, manual worker will benefit the most relative to other sectors whereas the smallest impact will be received by clerical worker.
The impact of each fiscal stimulus instrument on employment IntroductionResearch MethodologyCrisis OverviewEmployment DataSimulation and ResultConclusion and Policy Implication Some important findings. In terms of employment: First,the impact of fiscal stimulus policy on employment will be biased to worker in rural area, men and informal sector. Second, crops sector seem to received highest impact for any scenario in terms of number of jobs that are created. This is rational since crops sector is a labor intensive sector and the impact of all scenario are relatively larger on crops activities that will derive higher demand on labour. Third, the impact of extra government budget on infrastructure will not only increase number of worker in construction related sector but also other sectors and even larger on crops sector, restaurant sector and trade services sector.
Conclusion and Policy Implication IntroductionResearch MethodologyCrisis OverviewEmployment DataSimulation and ResultConclusion and Policy Implication Since the fiscal stimulus policy use either tax reduction or expansive government spending, the impact on Indonesian economic performance will be positive. However the magnitude and the most affected “stakeholders” will be differ across fiscal stimulus instrument. Any scenario will result a moderate and even a relatively higher impact on agricultural sector if the stimulus is conducted through personal tax cut or corporate income tax cut. Even though the main objective of some fiscal stimulus instrument are to improve the competitiveness of manufacturing sector but agricultural sector -as the primary sector- will benefit from the second round effect of the stimulus.
Conclusion and Policy Implication IntroductionResearch MethodologyCrisis OverviewEmployment DataSimulation and ResultConclusion and Policy Implication Fiscal stimulus policy through subsidy and value added tax reduction seems to be the most appropriate instrument to increase the competitiveness of manufacturing industry. However, the size of fiscal stimulus budget is matters which can be seen from a relatively low impact of value added tax cut policy. If government focus to improve the performance of manufacturing industry, Government of Indonesia should allocate more budget on these two instruments, namely subsidy and value added tax reduction. Construction sector, road sector and irrigation sector is expected to benefit the most if the fiscal stimulus policy is conducted through an expansion of government budget on infrastructure. These four important findings imply that the best fiscal stimulus policy to respond the Global Financial Crisis 2008 is conducted through mix policy since the impact of the crisis is existed in almost all sectors.
Conclusion and Policy Implication IntroductionResearch MethodologyCrisis OverviewEmployment DataSimulation and ResultConclusion and Policy Implication Type of production factor that will received the largest impact will significantly depend on the characteristic of sector that benefit from the stimulus. The benefit of fiscal stimulus policy will be bias to medium-high income household. If government want to support the low income household (agriculture employee, rural low income and urban low income), government should impose the fiscal stimulus policy on the sector that employ worker from a low income household groups, for instance agricultural sector, and trade sector. The impact will be a relatively larger on agricultural worker and manual worker Crops sector is mostly located in rural area, thus the impact of fiscal stimulus is significantly higher for employment in rural area. Since the structure of employment in Indonesia is majorly dominated by informal worker and mostly are men, the impact of fiscal stimulus is expected to biased to informal worker particularly on men worker.