Download
1 / 20
200 likes | 350 Views
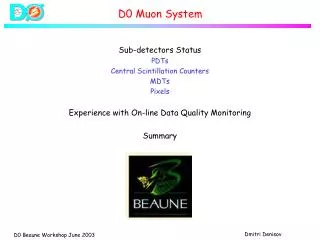
Use of ROOT in the D0 Online Event Monitoring System. J oel Snow, D0 Collaboration, February 2000. D0 Online Event Monitoring System. Three Major Components Data Acquisition System Monitoring Executables Graphical User Interface. Three Operating Systems Software Portability.

E N D
Use of ROOT in the D0 OnlineEvent Monitoring System Joel Snow, D0 Collaboration, February 2000
D0 OnlineEvent Monitoring System • Three Major Components • Data Acquisition System • Monitoring Executables • Graphical User Interface • Three Operating Systems • Software Portability Joel Snow, D0 Collaboration, February 2000
ROOTFramework • Provides • Portability • Physics analysis tools • Shared memory • Network sockets • Graphical widgets ROOT is an attractive choice for online monitoring applications Joel Snow, D0 Collaboration, February 2000
DataAcquisition System • Front-end electronics • Two levels of hardware triggers • Software trigger • Data transfer system Joel Snow, D0 Collaboration, February 2000
D0 Online Event Monitoring Physical Data Flow L3 Filter Node L3 Filter Node 100 Mbit Ethernet Gbit Ethernet L3 Filter Node L3 Filter Node 100 Mb Switch 100 Mb Switch Collector / Router Collector / Router 100 Mb Switch To FCC Gb Switch Data Logger Data Logger EXAMINE Data Distributor Buffer Disk Buffer Disk EXAMINE RIP Interface RIP Interface
Flow Control D0 Online Event Monitoring Logical Data Flow L3 Filter Node L3 Filter Node No Flow Control L3 Filter Node L3 Filter Node Collector / Router Collector / Router Routing based on Stream ID Data Logger Data Logger Data Distributor EXAMINE Distribution based on Trigger type Buffer Disk Buffer Disk EXAMINE RIP Interface RIP Interface To FCC To FCC
Monitoring Executables(Examines) Unpack raw data Reconstruct events Fill Histograms Provide event displays • Detectorperformance • Physics Objects - e's m's jets • Multiple Examines run on Linux PC's • Event selection via RCP file • Connect to DD with ACE • Apply algorithms to data • Interact with user interface Joel Snow, D0 Collaboration, February 2000
D0 Online Event Monitoring Processing Data and Message Flow Request Message DD Host Control Message Data Flow DD Register Commentary Event Buffer Assigned at the Requests Monitoring PC-Nodes Offline Framework Flow Initialize ReadEventDaq Process Events Finish Repeat Initiate separate threads Histogram Port. Message Interface Spawn an Examine Executable Histogram Interface . . . EvtDSP Interface Watchdogs for thread protection are separate Process Registry Start Processing Pause/ Resume EoR Query Stop Select Examine (Event display and other offline fwrk functions not added) Abort Status Select Input GUI Process Control Nodes
D0 Online Event Monitoring Histogram Control Flow Request Message DD Host Control Message Data Flow DD Event Buffer Assigned at the Requests Register Commentary Monitoring PC-Nodes Initialize ReadEvent Daq Process Events Finish Histogram Port Repeat Initiate a thread Histogram Interface Process Registry Input Select Reset Save Compare Display Print Update ROOT Cycle Hists Step Hists. GUI Histogram Control Nodes
D0 Online Monitoring Interaction Sequence Examine Main Thread Process Registry GetEvt Thread Other Threads Initialization Sequence GUI D/D Process Inquiry Initialize (Start Threads) Process List Initialize (Connect to D/D & Transfer Selections) Start Examine Ready(Threads begun) Start Process Ready (Connection made & buffer assigned) Initialize (Start Thread & assign buffer) Ready (Thread begun and Connected to D/D) Ready (All threads begun, Port #’s assigned) Ready (Examine begun, Port #’s assigned) Event Request Event Requests & Processing Events Event Processing Event Transfer Inquiries & Process Control (Pause, Resume, Reset, etc) Inquiries & Process Cntrl. Inquiries & Action Reports Status & Action Reports (Pause, Resume, Reset, etc) End of Run Signal End of Run Signal End of Process Inquiry Termination Sequence Finish & Clean up Terminate Terminate Up End of Process Request Terminated Terminated Terminated Terminated
GraphicalUserInterface Checks process registry Attach to existing Examine No control functions, observer mode Many may attach to single Examine Start new Examine Full control functions, creator mode • Control remote Examine • Obtain info from Examine • histograms • status/alarms Joel Snow, D0 Collaboration, February 2000
GUI Functions Histogram Display Step Compare Update Reset Cycle Save Print • Control • Start/Stop • Pause/Resume • Abort • Status • Dump Event • Display Event Joel Snow, D0 Collaboration, February 2000
Process Control
Histogram Display A ROOT Histogram Window
Cycling Histograms A ROOT Histogram Window
ROOT's Use • Main analysis tool for Examines • Results in ROOT object format • TFile, THxx, TNtuple • Examine - GUI communication • TSocket, TServerSocket, TMessage • Synchronous - control & histograms • Asynchronous - alarms & messages • Idle loop accessed by inheriting from TApplication • GUI built from widget classes • TGxxxx classes, TVirtualX Joel Snow, D0 Collaboration, February 2000
Conclusion • D0 online event monitoring system (D0OEMS) uses an asynchronous framework to reconstruct events, calulate physical quantities, and fill histograms • User interacts with framework through a GUI which provides information and control functionalities • Features of the ROOT framework have been successfully integrated into D0OEMS • While data taking is a year away, detector component commissioning is in progress. The D0OEMS described here is being used to verify the component performances • User response will guide future improvements • Hope to provide web based access of information to remote collaborators Joel Snow, D0 Collaboration, February 2000