Download
1 / 44
440 likes | 505 Views
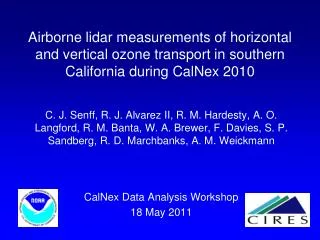
Stratosphere-Troposphere Transport (STT)in Southern California during CalNex Did it happen and does it matter?. A.O. Langford 1 , C.J. Senff 2, 1 , R. J. Alvarez II 1 , R.M. Hardesty 1 , R. M. Banta 1 , W.A. Brewer 1 , S.P. Sandberg 1 , R.D. Marchbanks 2,1 , A.M. Weickmann 2,1 ,

E N D
Stratosphere-Troposphere Transport (STT)in Southern California during CalNex Did it happen and does it matter? A.O. Langford1, C.J. Senff2, 1, R. J. Alvarez II1, R.M. Hardesty1, R. M. Banta1, W.A. Brewer1, S.P. Sandberg1, R.D. Marchbanks2,1, A.M. Weickmann2,1, J. Brioude2,1, O R. Cooper2,1, B.J. Johnson3, S.J. Oltmans2,3 1. CSD, NOAA ESRL, Boulder, CO, United States 2. CIRES, U. of Colorado, Boulder, CO, United States 3. GMD, NOAA ESRL, Boulder, CO, United States
Motivation The proposed reduction in the 8-h NAAQS from 75 ppbv to 60-70 ppbv places greater importance on understanding the sources and processes that influence “policy relevant background” O3 PRB is O3 that would exist in the United States in the absence of anthropogenic emissions from the United States, Canada, and Mexico. This includes O3 produced by photochemical reactions of NOx, VOCs, and carbon monoxide (CO) emitted from biogenic sources and wildfires, formed by lightning, transported across the Pacific from Asia and introduced into the troposphere from the stratosphere.
Stratospheric intrusions on the West Coast (winter-spring) Sprenger and Wernli, JGR, 108, D12, 8521, doi:10.1029/2002JD002636, 2003 Geographical distribution of lower tropospheric ‘‘destinations’’ of deep STT. Geographical distribution of mass flux associated with deep STT exchange events. Only “deep” (<3 km AGL) intrusions are likely to influence surface ozone
TOPAZ Measurements of Stratospheric intrusions over LA Basin during CalNex > 23 May 2010 >300 ppbv 1736 UT 1824 UT 29 May 2010 1748 UT 1836 UT
Stratospheric intrusion over LA Basin 29 May 2010 JTNP
Joshua Tree ozonesonde (IONS-2010)(Owen Cooper, Bryan Johnson, Sam Oltmans) 29 May 2010
FLEXPART forward trajectory model(Jerome Brioude) Particles transported by resolved winds and parameterized subgrid motions. NCEP GFS winds: 0.5° x 0.5° horizontal, 26 vertical levels, 3-hour steps. Emanuel and Zivkovic-Rothman parameterization convection Tracers Stratosphere: 25-55°N, 140-90°W, >2 PVU (60 ppbv/PVU), 10 days Free troposphere: 10-50°N, 140-90°W, 70-60 ppbv (PBL to 2 PVU), 10 days Asia: Asian sources (EDGAR 3.2) 0.33 CO (Heald et al.), 20 days Biomass burning : N. American and Asian sources 0.2 CO (McKeen et al.), 20 days Target Domains Santa Barbara: 34-35°N, 121-119°W 0-1, 0-3, 3-6 km AGL LA Basin: 33.5-34.5°N, 119-117°W 0-1, 0-3, 3-6 km AGL Mojave: 33.25-34.25°N, 117-115°W 0-1, 0-3, 3-6 km AGL
FLEXPART trajectories(Jerome Brioude) 18UT 23 May 2010 4 km MSL 18UT 29 May 2010 4 km MSL
FLEXPART Results: (3-6 km) B Brad Pierce 4 major STT events during IONS-2010 (3 on weekends) Excellent correlation with ozonesondes (R=0.92) SB LAB MD
ARB Ozone surface stations Use Santa Barbara LA Basin Mojave Desert Use Maximum Daily 8-h average (MDA8) O3
MDA8 O3 along NW-SE transect during IONS-2010 (9 May – 19 June) 30 May 5 June Subtropical airmass in early June 5 Exceedance episodes in east Basin Highest average O3 in Mojave Desert SB LA MD
FLEXPART Results: (0-1 km) 30 May 5 June Three major STT episodes No free tropospheric source for peaks No Asian transport or biomass burning SB LAB MD
Principal Component Analysis • PCA is non-parametric technique used to identify patterns of common variance in large datasets. • Requires no assumptions about the data distribution. • Principal components (PCs) are linear combinations of original variables weighted by coefficients (or loadings) ranging from -1 to +1.
PCA Results Loadings Amplitudes 5 June 30 May 59% 16%
MDA8 O3 along NW-SE transect resolved into PC1 (photochemistry) and PC2 (transport) contributions 30 May 5 June PC1 only contributes to 5 June peak PC2 increases O3 >10 ppbv in Santa Barbara on 30 May PC2 decreases O3 >10 ppbv in Mojave Desert on 30 May SB LA MD
Santa Barbara UT/LS 80 ppbv O3 Low VOC, Low NOx Marine 40 ppbv O3 High VOC High NOx 60 ppbv O3 Med-High VOC Med-High NOx +20 ppbv
Los Angeles UT/LS 80 ppbv O3 Low VOC, Low NOx Urban 80 ppbv O3 High VOC High NOx 80 ppbv O3 Med-High VOC Med-High NOx +0 ppbv
San Bernardino UT/LS 80 ppbv O3 Low VOC, Low NOx Polluted 100 ppbv O3 High VOC High NOx 90 ppbv O3 Med-High VOC Med-High NOx -10 ppbv
Summary • STT did affect surface O3 in LA Area during CalNex. • 29-30 May event increased surface O3 in Santa Barbara, • Orange, Ventura and parts of Los Angeles counties. • increase of ≈10-20 ppbv in Santa Barbara County (68 ppbv) • decrease of ≈10 ppbv in eastern San Bernardino County. • STT may lead to spring exceedances with lower standard.
Acknowledgements NOAA AOC Twin Otter crew NOAA Health of the Atmosphere Program CA Air Resources Board Joshua Tree National Park
County-high MDA8 O3 during 2010 IONS-2010 NAAQS Spring and Fall maxima in Santa Barbara Summertime increase across Basin Exceedances in east Basin April-Sept. Highest MDA8 on June 5 (Crestline) Less variability in High Desert SB LA MD
County-high MDA8 O3 during 2010 County-high MDA8 O3 during 2010 (less Santa Barbara) IONS-2010 Summertime increase across Basin Highest summer O3 in east Basin Episodic transport to Santa Barbara from Central Valley in Fall SB LA MD
MDA8 along NW-SE transect during 5 high O3 episodes SB LAB MD Little or no O3 increase on 23 May Largest increase in west on 30 May Similar trends on all other days SB LAB MD
Stratospheric intrusions during CalNex • 9-10 May (ozonesonde) • 11-12 May (WP-3D, ozonesonde) • 19 May (ozonesonde) • 23 May (TOPAZ) • 29 May (TOPAZ, ozonesonde) • 11-12 June (ozonesonde) • 16 June (ozonesonde) • 26 June (TOPAZ)
Orographic Lifting “Long‐range transport of ozone from the Los Angeles Basin: A case study” Lifting of ozone plume above the San Gabriel Mountains by the Mountain Chimney Effect 3-8 km MSL 300m AGL Langford et al., GRL, VOL. 37, L06807, doi:10.1029/2010GL042507, 2010
Orographic lifting by San Gabriel Mountains during CalNex 2 July 2010 15 July 2010
Transport from Asia “Increasing springtime ozone mixing ratios in the free troposphere over western North America” Resi Residence times of FLEXPART back trajectories from highest 33% of 1984-2008 Western N.A. ozone measurements 3-8 km MSL 300m AGL Cooper et al., Nature, Vol 463| 21 January 2010| doi:10.1038/nature08708
Asian transport layers during CalNex 18 June 2010 22 June 2010 Redding (NASA B200) Redding Sacramento
Asian transport layers during CalNex 22 June 2010
Surface impacts of stratospheric intrusions during CalNex Examine daily ma 8-h ozone in Examine daily max 8-h ozone in 5 coastal air basins