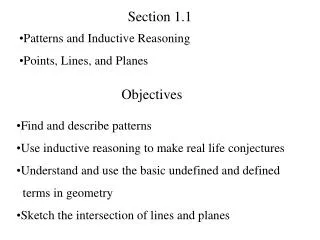
Section 1.1
Section 1.1. 1. Find the outcome space for each of the following experiments: (a) (b) (c) (d) (e). A teenager is selected at random from a street corner and his/her natural hair color is determined. {black, brown, blond, red}.

Section 1.1
E N D
Presentation Transcript
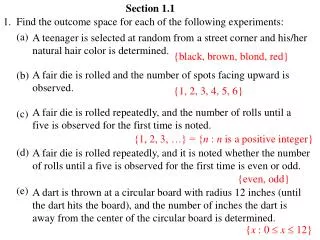
Section 1.1 1. Find the outcome space for each of the following experiments: (a) (b) (c) (d) (e) A teenager is selected at random from a street corner and his/her natural hair color is determined. {black, brown, blond, red} A fair die is rolled and the number of spots facing upward is observed. {1, 2, 3, 4, 5, 6} A fair die is rolled repeatedly, and the number of rolls until a five is observed for the first time is noted. {1, 2, 3, …} = {n : n is a positive integer} A fair die is rolled repeatedly, and it is noted whether the number of rolls until a five is observed for the first time is even or odd. {even, odd} A dart is thrown at a circular board with radius 12 inches (until the dart hits the board), and the number of inches the dart is away from the center of the circular board is determined. {x : 0 x 12}
2. Find the outcome space for each of the random variables defined: (a) (b) An urn contains 10 red chips, 20 blue chips, 15 yellow chips, and 5 white chips. One chip is randomly selected and its color is noted. The random variable X is defined as follows: X(red) = $1, X(blue) = $5, X(yellow) = $10, X(white) = $25. outcome space for X = {1, 5, 10, 25} An urn contains 24 chips each labeled with a letter followed by an integer. The labels are a1, a2, …, a7, b1, b2, …, b8, c1, c2, …, c9. One chip is selected at random and its label is observed. The following random variables are defined: X(ai) = X(bi) = X(ci) = i , Y(ai) = 1, Y(bi) = 2, Y(ci) = 3 , Z = X + Y. {1, 2, 3, 4, 5, 6, 7, 8, 9} outcome space for X = outcome space for Y = outcome space for Z = {1, 2, 3} {n : 2 n 12 and n is an integer}
(c) A dart is thrown randomly at a circular board with radius 1 foot (until the dart hits the board). The random variable X is defined to be "the number of feet the dart is away from the center". outcome space for X = {x : 0 x 1} Create the Excel file Describe_Data which displays the raw frequencies and relative frequencies for an integer data set. 3. (a) (1) (2) (3) Create the Excel file by performing the following steps: In Sheet1, select cells A1:A500, and color these cells with a light color such as yellow. Change the name of Sheet1 to Ungrouped. Enter the labels displayed in cells B1, E1, D4, E3, E4, F3, and F4, changing formatting and column width as necessary. (4) Select the cells D5:F20, and format these cells so that the display is centered.
(5) (6) Select the cells D5:D20. From the main menu select the Formulas tab, select the option Name Manager, and click the New button in the dialog box which appears. (7) Type the new range name Values (if it is not already displayed), and click the OK button to return to the Name Manager dialog box. (8) With the Name Manager dialog box still open, click the New button, type the new range name IntegerData (no spaces!), and click inside the Refers to slot. (9) With the Refers to slot selected, highlight cells A1:A500, click the OK button to return to the Name Manager dialog box, and click the Close button to close the dialog box. (10) Enter the following formula in cell D5: =IF(COUNT(IntegerData)>0,MIN(IntegerData),"-") (11) Enter the following formula in cell D6: =IF(D5="-","-",IF(MAX(IntegerData)>=D5+1,D5+1,"-")) (12) Copy cell D6 down to cells D7:D20, and then enter the following formula in cell D21: =IF(D20="-","",IF(MAX(IntegerData)>=D20+1,"Class intervals are needed!","")) (13) Select cells E5:E20, and type the following formula: =IF(Values="-","-",FREQUENCY(IntegerData,Values)) (14) While holding down the {Shift} and {Ctrl} keys together, press {Enter}.
(15) (16) (17) Enter the following formula in cell F5: =IF(Values="-","-",E5/COUNT(IntegerData)) Copy cell F5 down to cells F6:F20. Save the file as Describe_Data (in your personal folder on the college network). (b) Use the Excel file Describe_Data to obtain a histogram for the data in Example 1.1-9 of the textbook. (Open Excel file Data_for_Students in order to copy the data of Example 1.1-9.)
4. (a) (b) An urn contains one chip labeled with the integer 0, three chips each labeled with the integer 1, and five chips each labeled with the integer 2. One chip is to be selected at random and the random variable X is defined to be “the integer labeled on the selected chip”. Find the outcome space for X. {0, 1, 2} Assign a reasonable p.m.f. (probability mass function) for the random variable X. if x = 0 f(x) = if x = 1 if x = 2 1/9 3/9 = 1/3 5/9 or f(x) = (2x + 1) / 9 if x = 0, 1, 2