Download
1 / 37
370 likes | 475 Views
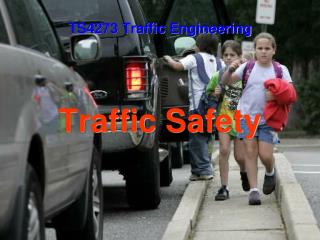
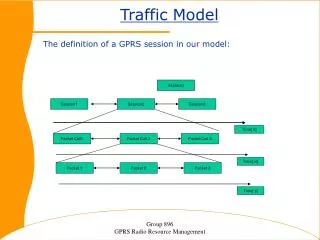
A Data Model for University-based Traffic Safety Research. 29 th International Forum on Traffic Records July 13 - 17, 2003. Zachary Hans, P.E. Overview. Introduction Extent of Research Key Components Character of Safety Activities. Introduction.

E N D
A Data Model for University-based Traffic Safety Research 29th International Forum on Traffic Records July 13 - 17, 2003 Zachary Hans, P.E.
Overview • Introduction • Extent of Research • Key Components • Character of Safety Activities
Introduction • CTRE is the focal point for transportation at Iowa State University. • Traffic safety activities include • Applied Research • Software development/deployment • Education • Crash data mining and presentation
Extent of Research • Begins with crash data collection. • Ranges from site specific to system wide. • Can be qualitative in nature. • Encompasses multiple disciplines.
Key Components • Rich, Statewide Crash and Roadway Databases • GIS-based • All public roads • 10 years (crashes) • ~100 attributes (crashes) • Analysis Tools • Multidisciplinary and interagency cooperation.
Character of Safety Activities • Crash Data Collection & Sketch-level Analyses • Best Practices & Policy Assessment • High Crash Location Identification & Ranking • Project & Site Review • Targeted Enforcement
Command Menus Map Manipulation Buttons Crash Data Collection • Incident Location Tool • GIS-based • ~220 agencies • ~50% Crashes • Drivers Services • Remaining 50% • TraCS Utility, used by several states • Improved crash locations, resulting in improved analyses. Map Window Incident Location Tool – Graphic User Interface
Sketch-level Analysis • Incident Management & Analysis Tool (IMAT) • GIS-based • Designed for novice users & simple spatial analyses • FREEfrom Iowa DOT, incl. training • Facilitates quick and easy frequency-based analyses for all user levels.
Best Practices Assessment • Evaluate the possible safety-related impacts of different policies and practices (design, traffic control, and maintenance). • Quantify the magnitude of a problem. • Investigate differences in crash history. • Develop guidelines and recommendations.
Best Practices Access Management Strong Correlation between Commercial Driveway Density and Crash Density 40% Ave Reduction in Crash Rates after Access Management
Access Management Good Management Poor Management There is a strong correlation between access density and broadside collisions Courtesy of Dave Plazak, CTRE
Best Practices Red Light Running • Scope, Impact, and Possible Implications
Best Practices Angle Parking • …on Iowa’s Low Volume Primary Extensions in Small Towns • Findings: No compelling justification for blanket prohibition
Best Practices Accommodating Older Drivers • Assessing Older Driver Mobility Issues
Best Practices Development of Guidelines • Handbook of Simplified Practice for Traffic Studies • Traffic Control Strategies in Work Zones with Edge Dropoffs • Traffic Control Devices and Pavement Markings: A Manual for Cities and Counties
Policy Assessment • Evaluate the possible safety-related impacts of different policies or legislative mandates, such as… • Blood Alcohol Content (BAC) – 0.08 v. 0.10 • In-vehicle restraint requirements – Age, Seating Position
High Crash Location Identification and Ranking • What qualifies as a high crash location? • How should locations be compared? • Identification of high crash locations, given certain criteria
High Crash Location Ranking • Evaluation of the Iowa DOT’s Safety Improvement Candidate List Process • Impact of fatalities on ranking • Influence of different weighting frequency, rate, value loss on ranking • Develop a new weighting system
Safety Candidate Site Evaluation Number of Locations Dropped When Crash Frequency Varied Impact on Ranking Change in Rank When First Fatality Is Changed to Major Injury
Systematic Identification of High Crash Locations • Head-on • Horizontal • Curves • Urban, Four-lane • Undivided Corridors • Four-lane, Rural • Expressway Intersections • Fixed • Objects
High Crash Curves Top 30 Average • 11.5/mvm • f=9.5 • $490,000 Loss • 5% of crashes (1% of curves) • 11% of all fatalities Statewide Average • 1.4/mvm • f=1.9 • $55,000 Loss Worst • 27.4/mvm • f=14 • $960,000 Loss Curve length and degree of curvature are significant causal variables.
High Crash Curves: Low Cost Mitigation BEFORE Improved Signage AFTER
Iowa DOT District 1 Rural Two-Lane Primary Road Fatalities and Major Injuries (1998-2000) 20 unlocated injury severities not represented. (0 Fatal, 20 Major Injuries) Disclaimer: The Center for Transportation Research and Education presents these data as preliminary.
Project & Site Review • Evaluate the safety-related impact of a project • Compare facilities of similar types. • Identify locations with specific problems.
Before After Widening 1993 -1995 1998 - 2000
Iowa-141 Fatalities & Major Injuries (1996-2000) (Between I-35/I-80 & Iowa-17) Crash Rate/100 Million VMT: For the Study area (1996-2000) = 74.41 Statewide Rural Primary (1995-1999) = 122 Disclaimer: The Center for Transportation Research and Education presents these data as preliminary.
School-Age Pedestrian Crashes City of Des Moines 1995 to 1999 Ages 5 to 19 August 15 to June 15 Monday to Friday 7:00 a.m. to 5:00 p.m. Middle Schools
Targeted Enforcement • Provide law enforcement with corridor crash history to facilitate collaborative enforcement events. • Provide law enforcement with locations of specific types of crashes to refine enforcement efforts.
Rural Alcohol-Related Fatal and Major Injury Crashes Rural Alcohol-Related Crashes: Corridors Ranked by Frequency
Other Safety-Related Efforts • Iowa Traffic Safety Data Service (ITSDS) • Funded by GTSB and Iowa DOT • Aides agencies in obtaining, mapping, and evaluating crash information. • FY02: 63 requests from 23 agencies • Safety Circuit Rider • Provides conferences, workshops, technical advice for traffic safety related topics • 2001: 54 workshop presentations with 1500 participants • Law Enforcement Liaison
Review • Traffic safety research begins with the data. • Key research components are extensive crash and roadway databases, analysis tools and multidisciplinary approach. • Research activities range from site specific to system wide analyses and may promote end user interpretation.
Questions? Zachary Hans, P.E. zhans@iastate.edu 515.294.2329 Center for Transportation Research and Education Iowa State University 2901 S. Loop Drive, Suite 3100 Ames, Iowa 50010-8632 www.ctre.iastate.edu