Download
1 / 59
600 likes | 735 Views
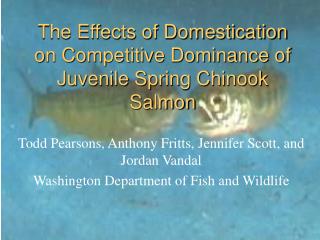
The Influence of Hatchery Rearing on Tucannon River Spring Chinook. Michael Gallinat WDFW. Purpose of this talk…. Provide a quick background on hatchery management of Tucannon Spring Chinook. Describe the influence of hatchery rearing on selected phenotypic traits.

E N D
The Influence of Hatchery Rearing on Tucannon River Spring Chinook Michael Gallinat WDFW
Purpose of this talk… • Provide a quick background on hatchery management of Tucannon Spring Chinook. • Describe the influence of hatchery rearing on selected phenotypic traits. • Inform you about the latest cutting edge advancements in fisheries phenomenon and ask really deep philosophical ?’s. • Describe our latest attempts to improve survival of our hatchery fish & possible genetic implications.
LSRCP Mitigation Program • Hatchery mitigation was for 48% loss (1,152) through the dams with the remaining 52% (1,248) expected to be self-sustaining. • Mitigation was to be accomplished by the annual release of 132,000 smolts with an assumed SAR of 0.87%.
Evaluation program was established in 1985 to monitor the success of the program in achieving the mitigation goal. • First smolts (derived from wild Tucannon brood) were released in 1987. • Since 1989, the hatchery broodstock has consisted of both H & N origin fish (strive for 50:50 ratio). • The stock was listed as “Threatened” under the ESA in 1992.
Relatively stable runs from 1985-1993 (mean = 550 fish) • Between 1994-1999 the average run declined to 196 fish (range 54-351) Hatchery Mitigation Goal = 1,152
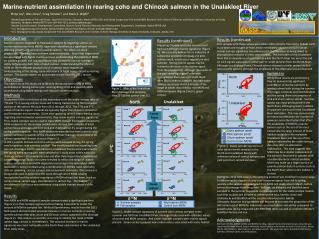
Purpose/Goal • To artificially boost broodstock numbers over the course of one generation (5 brood years – 1997-2001) and supplement the population through a bottleneck situation. • Captive broodstock were selected from the hatchery supplementation program (HxW, HxH, and WxW parents) with a progeny release goal of 150,000 smolts @ 15 fpp.
With the captive brood program we can now look at three levels of hatchery influence on the same stock… Captive Brood - extreme influence. Hatchery-origin - partial influence. Natural-origin - minimal influence.
Nature Nurture Versus
Index of Relative Fecundity Modified Index of Relative Fecundity = Fecundity ÷ Fork Length “Normally” = Fecundity ÷ Body Weight
Maybe they just allocate/partition it differently?Maybe Hatchery fish = Natural fish?? Index of Reproductive Effort = Fecundity x Egg Wt.
Gallinat’s Phenomenon Phenomenon whereby hatchery-origin fish are able to divert more energy than natural-origin fish in producing larger eggs due to a readily available food supply and protected hatchery environment. These larger eggs result in overall lower fecundities at size compared to naturally-reared fish.
What does this mean in the big picture? Productivity might be lower with a higher composition of hatchery-origin fish in the run…
Is this a “bad” thing…hatchery fish that are less fecund? Might not be “bad”…if based on DNA analysis they are genetically the same…might actually be preserving genes with the hatchery program! Would just have to use natural fish equivalents in comparisons.
Smolt-to-Adult Returns 0.87 SAR
Smolt-to-Adult Returns 0.87 SAR
Yikes!! • Based on the current average hatchery SAR of 0.22% (well below the original goal of 0.87%) the program would need to produce over 500,000 smolts annually to meet the hatchery mitigation goal of 1,152 returning hatchery adults.
How can we increase survival?(Thereby mining less broodstock from the river….) • Emphasis change from quantity to quality!
What are some of the methods to do this? • Exercise Experiments? • “Nature’s” Rearing? • Increase Smolt Size?
Survival vs. Size at Release (Appleby and Keown 1995)
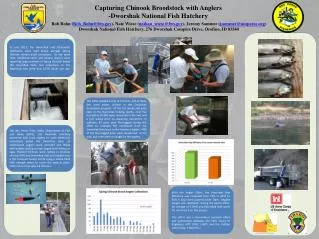
Size at Release Study (06-08 BY’s) • 9 fpp (“large” size) vs. 15 fpp (“small” size) • CWT + VIE (blue & purple) • 2,500 PIT tags in each group
What might the results tell us? • If there’s no difference in survival then it’s more cost effective to rear the “small” fish. • If the “large” fish have significantly higher SAR’s - than we may be able to collect fewer broodstock from the river in the future.
Q: Isn’t having a larger number of jacks/precocials a bad thing? …and that’s exactly what will happen if we release larger hatchery smolts.
Todd Pearsons (WDFW) asked… “Are you experiencing what we see in the Yakima?” You have to look closer…
“I just see a bunch of small wild fish…” “We have to capture them??…”
How does Todd’s crew catch them? • Underwater angling. • Pooper Scooper???? I DON’T THINK SO!!!!!!
Interesting Study… DNA-based parentage assignment study from the Cle Elum spawning channel (Yakima River)
So Are Jacks Bad? Philosophical ?’s… • Don’t large numbers of jacks indicate good survival and tend to foreshadow good/strong runs? • Precocial males are a characteristic of spring Chinook populations – if the hatchery environment just causes it to be expressed without changing the population’s genetic structure - why worry about it? • May actually even increase genetic diversity!
Our natural-origin fish aren’t replacing themselves for the most part so why do we want to imitate them? • The environment has changed from what they adapted/evolved for… • Dams/Global Warming/Ocean Dead Zones/Loss of Estuary Habitat/Predator Changes/Forage Changes/etc., etc.
If it’s genetically caused wouldn’t we see more jacks in the natural population…since we limit the number of jacks brought into the hatchery? • Large natural-origin jack runs don’t tend to follow large natural-origin jack runs. • And…aren’t increased numbers of females what we’re really after anyway?
Fish Management Dilemma… • If we actually achieve increases in our hatchery fish survival it could decrease our Proportionate Natural Influence (PNI) below 50%.