Download
1 / 18
190 likes | 217 Views
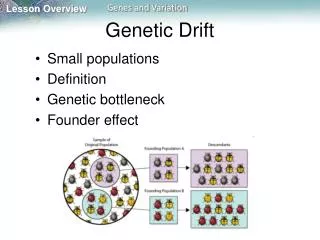
Explore genetic drift using tuco-tucos as a model organism. Understand how allele frequencies change over time and the impact of random and nonrandom processes on evolution. Engage in group activities to simulate genetic drift and discuss its ecological examples such as the founder effect and bottleneck events. Reflect on the effects of genetic drift and its implications for populations and species.

E N D
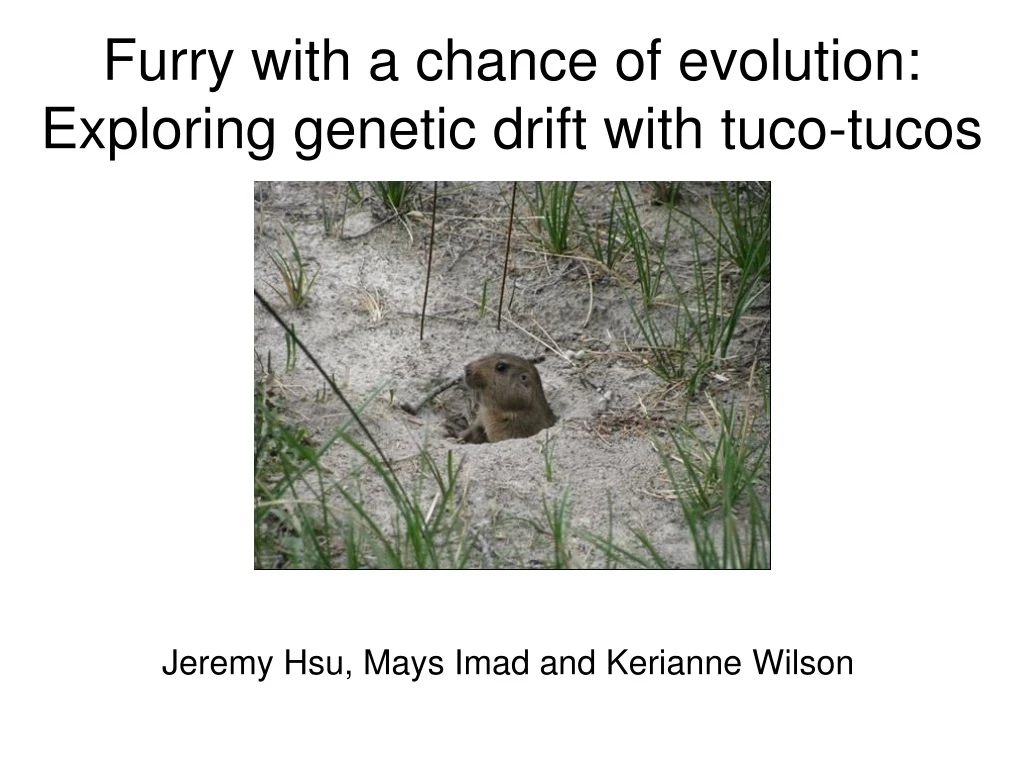
Furry with a chance of evolution: Exploring genetic drift with tuco-tucos Jeremy Hsu, Mays Imad and Kerianne Wilson
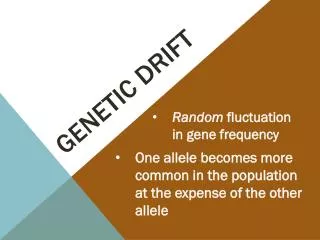
Thought questions You track a population of tuco-tucos over time and notice that the trait (allele) frequency of a given gene changes over time, as shown above. • Do you think this population is evolving? • Do you think that this pattern can be due to 1) random processes, 2) nonrandom processes, or 3) both random and nonrandom processes?
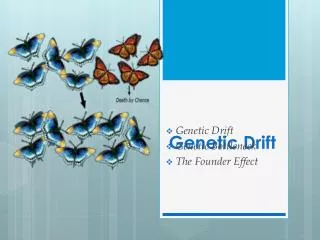
Group Activity: Genetic Drift in Tuco-tucos • Work in groups of 2 or 3. • Each of your brown and white beans represents an individual tuco-tuco. The color represents the color of their pelage (i.e.: coat), a trait that does not affect their fitness and is not under natural selection.
Example of one generation Start with a population of 4 brown and 4 white beans.
Example of one generation For each generation, randomly select 4 individuals thatwill contribute their characteristics to the next generation.
Example of one generation For each generation, randomly select 4 individuals thatwill contribute their characteristics to the next generation.
Example of one generation Duplicate these 4 individuals to bring the population back to 8 tuco-tucos so population size remains constant.
Example of one generation Now record the total number of brown& white individuals in your table. Now repeat for five minutes!
Group Activity: Genetic Drift in Tuco-tucos • Start with 4 brown and 4 white beans. • For each generation, randomly select 4 individuals that will contribute their characteristics to the next generation. • Duplicate these 4 individuals to bring the population back to 8 tuco-tucosso population size remains constant. • Now record the total number of brown& white individuals in your table. • Repeat as many times as you canfor about 5 minutes.
Thought questions • How does the final ratio of bean colors in the population compare to what it was before you started? • If the ratio changed, was there a reason why it changed in the particular direction you observed, or do you think the change was random? Explain why.
Follow-up Group Activity: Genetic Drift in Tuco-tucos How might population size change the outcome?
Follow-up Group Activity: Genetic Drift in Tuco-tucos How might population size change the outcome? Predict how the color ratio would change across generations if the population had 100 individuals. Is fixation possible if a population had 1,000 individuals?
Ecological examples of the impact of genetic drift: Founder effect Huntington’s Disease Normal [Include photos of a normal brain and one from a person with Huntington disease] [Include map of South America depicting density of Huntington disease cases] Rare world-wide, but areas with high concentrations exist from founder effect http://web.stanford.edu/group/hopes/cgi-bin/hopes_test/population-genetics-and-hd/ For more information: http://web.stanford.edu/group/hopes/cgi-bin/hopes_test/the-basic-neurobiology-of-huntingtons-disease-text-and-audio/
Ecological examples of the impact of genetic drift: Founder effect Founding lizard limb length Lineage A Lineage B Lineage C Lineage D Lineage E Caribbean brown anole lizard experiment [Include a photo of a Brown Anolis lizard from the URL below of a layman press release of the study] https://www.sciencedaily.com/releases/2012/02/120202151127.htm Natural selection lead to the reduction in limb lengths for all lineages, but founder effect maintained the relative length of limbs among lineages Current lizard limb length Lineage A Lineage B Lineage C Lineage D Lineage E Original Science article: http://science.sciencemag.org/content/sci/335/6072/1086.full.pdf
Ecological examples of the impact of genetic drift: Bottleneck [Include map from Cheetah Conservation Fund] https://cheetah.org/about-the-cheetah/genetic-diversity/ • Results: • Poor sperm quality • Immune system homogeny • Kinked tails
Ecological examples of the impact of genetic drift: Bottleneck New Zealand Black Robin [Include conservation photos from URL below] [Include photo(s) of the black robin from the below URL] http://www.endangeredspecies.org.nz/store/doc/Black%20robin%20Endangered%20species%20factsheet.pdf https://toughlittlebirds.com/2013/03/29/the-incredible-story-of-the-black-robin/ Entire species descended from one male and one female. Results: No reported abnormalities yet
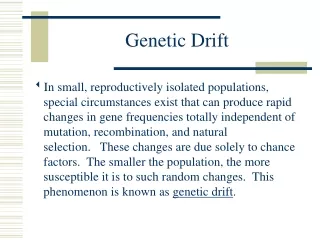
What we have learned... • Genetic drift causes evolutionary change and is a random process • Genetic drift acts more strongly on smaller populations • Genetic bottlenecks and founder effects are two real-life events that create smaller populations more susceptible to the effects of genetic drift.
Thought questions You track a population of tuco-tucos over time and notice that the trait (allele) frequency of a given gene changes over time, as shown above. • Do you think this population is evolving? • Do you think that this pattern can be due to 1) random processes, 2) nonrandom processes, or 3) both random and nonrandom processes? • How would your answer to questions 1 and 2 change if you knew the trait above was or was not being affected by natural selection?