Download

1 / 6
60 likes | 72 Views
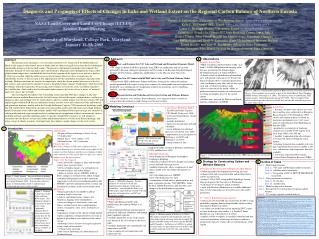
This paper illustrates the Land use Land cover detection and floral diversity of Gujarat science city campus, Ahmedabad, Gujarat, India. It is one of the science centers of the Gujarat state managed by the State Government. The initiation of this science center is to acknowledge students towards the science field. Arc GIS is used to detect the vegetation patches and analysis of Land use Land cover of the study area. The Unsupervised classification has been performed to analyze the study area. High resolution satellite image used for identifying the land use land cover classes. Out of which, the major area is covered by vegetation and constructed area. The major part is occupied by vegetation. The plant survey carried out in January 2020. The flora of campus consists of 73 species which belongs to 44 genera and 32 families. Herbs and shrubs were dominant as compared to the trees. Herbs were recorded with 15 species, while shrubs with 32 species, climbers with 10 species and trees with 11 species. These species were cultivated for ornamentation of the campus. Kruti Chaudhari | Nirmal Desai | Bharat. B. Maitreya "Land use Land Cover and Vegetation Analysis of Gujarat Science City Campus, Ahmedabad, Gujarat" Published in International Journal of Trend in Scientific Research and Development (ijtsrd), ISSN: 2456-6470, Volume-4 | Issue-4 , June 2020, URL: https://www.ijtsrd.com/papers/ijtsrd31232.pdf Paper Url :https://www.ijtsrd.com/biological-science/botany/31232/land-use-land-cover-and-vegetation-analysis-of-gujarat-science-city-campus-ahmedabad-gujarat/kruti-chaudhari<br>

E N D
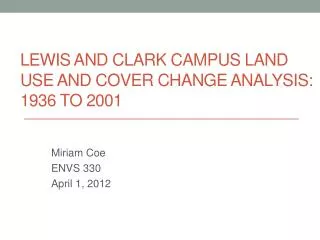
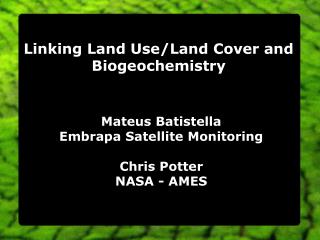
International Journal of Trend in Scientific Research and Development (IJTSRD) Volume 4 Issue 4, June 2020 Available Online: www.ijtsrd.com e-ISSN: 2456 – 6470 Land use Land Cover and Vegetation Analysis of Gujarat Science City Campus, Ahmedabad, Gujarat Kruti Chaudhari, Nirmal Desai, Bharat. B. Maitreya Department of Botany, Bioinformatics and Climate Change Impact Management, School of Science, Gujarat University, Ahmedabad, Gujarat, India ABSTRACT This paper illustrates the Land use Land cover detection and floral diversity of Gujarat science city campus, Ahmedabad, Gujarat, India. It is one of the science centers of the Gujarat state managed by the State Government. The initiation of this science center is to acknowledge students towards the science field. Arc GIS is used to detect the vegetation patches and analysis of Land use Land cover of the study area. The Unsupervised classification has been performed to analyze the study area. High-resolution satellite image used for identifying the land use/ land cover classes. Out of which, the major area is covered by vegetation and constructed area. The major part is occupied by vegetation. The plant survey carried out in January 2020. The flora of campus consists of 73 species which belongs to 44 genera and 32 families. Herbs and shrubs were dominant as compared to the trees. Herbs were recorded with 15 species, while shrubs with 32 species, climbers with 10 species and trees with 11 species. These species were cultivated for ornamentation of the campus. KEYWORDS: Floral diversity; GIS; Land use Land cover; Satellite Image; Species How to cite this paper: Kruti Chaudhari | Nirmal Desai | Bharat. B. Maitreya "Land use Land Cover and Vegetation Analysis of Gujarat Science City Campus, Ahmedabad, Gujarat" Published in International Journal of Trend in Scientific Research and Development (ijtsrd), ISSN: 2456- 6470, Volume-4 | Issue-4, June 2020, pp.879-884, www.ijtsrd.com/papers/ijtsrd31232.pdf Copyright © 2020 by author(s) and International Journal of Trend in Scientific Research and Development Journal. This is an Open Access article distributed under the terms of the Creative Commons Attribution License (CC (http://creativecommons.org/licenses/by /4.0) IJTSRD31232 URL: BY 4.0) INTRODUCTION This paper deals with the species diversity and land use pattern of Gujarat Science City campus.A Geographical information system is a computerized tool designed for the management and use of spatial data (Hasmadi M.I. et al., 2010). Remote sensing and GIS frequently used by researchers for plants mapping or vegetation mapping and Land use Land cover detection as well as investigation of before and after the state of earth’s surface. Remote sensing and GIS provide effective means to study the vegetation cover change, Satellite data brings the information of the target area at any given time; these data can be reused and re-assessed for the change detection in a selected area. Remote sensing and GIS forms an easy way to analyzes Land use Land cover change. Species distribution and abundance patterns influenced plant species diversity of any geographical region (Day and Monk 1974). Campus gain the attention of students as well as people through its unique design, different sculpture, and Life Science Park. Ornamentation of campus attracts the people. The diversity of plant species is different from one geographic region to another. The vegetation of campus contributes to the greenery of Ahmedabad city. The vegetation of the campus plays an advanced role in species richness of urban areas due to increased urbanization in Ahmedabad city. Minakshi Goswami and Khire M.V. 2016 reported various changes in the land use pattern of the city. The built-up area of Ahmedabad city was increases by 33% to 53 %, and vegetation area decreased by 33% to 27% from 1999 to 2011. P Mohammad et al., 2019 analyzed LULC of Ahmedabad city, they divided the city into two zones; urban zone and the rural zone. And for the better representation, they form various classes of LULC such as Cropland, Herbaceous cover, Mosaic natural vegetation, Shrubland and Grassland, Built-up area; based on how the land is used. Herbaceous cover of the urban zone is only 1.12 km2 means 0.53%. In rural zone, herbaceous cover is 0.71km2 and in percentage, it is 0.16%. 0.42 km2 area is occupied by Mosaic natural vegetation which includes tree, shrub, herbaceous cover as well as cropland. It is 0.20% in the urban zone. The Mosaic natural vegetation covers 3.42 km2, 0.80% area in the rural zone. Shrubland is 0.02 km2, in the urban zone, and in the rural zone, it is 0.25 km2, 0.06% area covered by shrubs. Grassland is up to 1.24 km2, 0.59% in an urban area. In the rural zone, it is 0.01km2 only. The Built-up area in the urban zone is 191.25 km2, up to 90.63% which covers the major land of urban zone. In rural zone, it is 35.06 km2 The vegetation of a particular area can play a key role as an environmental indicator. Urban green space fragmentize and isolating from rural green areas due to the urban sprawl, furthermore the natural biological diversity of urban areas negatively affected by an unplanned change in land use and land cover (Vare and Rekola 2007). Vegetation acts as an @ IJTSRD | Unique Paper ID – IJTSRD31232 | Volume – 4 | Issue – 4 | May-June 2020 Page 879
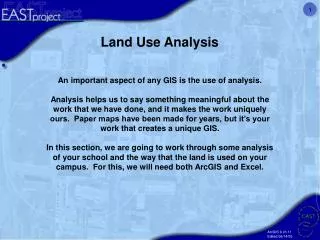
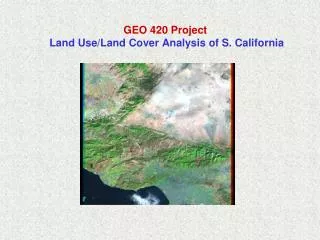
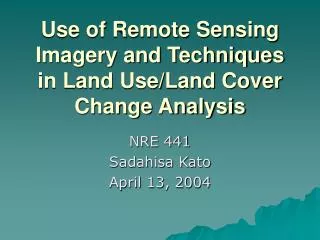
International Journal of Trend in Scientific Research and Development (IJTSRD) @ www.ijtsrd.com eISSN: 2456-6470 acoustic screen between noise- sources and receivers but also prevent noise by generating pleasant sounds. This positive impact play role of benefits to humans mental and physical health as well as children’s growth and their educational results (Gonzalez- oreja JA et al., 2010, Nijland HA et al., 2003, Kaplan R, 2001, Taylor AF 2002, Van Renterghen T et al., 2012) Urban greenery decorates natural or artificial scenery, it helps human to reduced stress by providing pleasant visual quality. An investigation reveals that green views increased the capacity of recovery of an ill person (Ulrich RS 1984, Van den Berg AE et al., 2010) and also increased concentration ability. Emili Redon et, al., 2020 explore the “bigLeaf” approach of the interaction soil- Biosphere-Atmosphere (ISBA) model deals with energy exchange between atmosphere and vegetation, they reported that the canopy trees and mass of vegetation can reduce the temperature and maintain the- the town energy balance. Urban greenery or vegetation not only makes human comfort but also provides economic benefits via decreasing energy and health care costs. Natural vegetation is difficult to maintain in the era of globalization due to urban sprawl. Cultivated gardens and green areas are bringing the taxonomic richness and increase the greenery of Ahmedabad city. Objectives 1.To detect vegetation patches through remote sensing. 2.To quantification of Land use Land cover of study area through iso cluster unsupervised classification. 3.To list out the plants of the study area by ground survey. Material and Method Study area The Gujarat Science City is a government’s initiative to educate students in the science field. The campus situated between 23.0800⸰ N and 72.4936⸰ E. Study area is approx. 6.495 km2. Half of the area is without any infrastructure due to the reason campus is maximum covered by vegetation. In the future, it is expected that there would be a change on campus. It is the most visited place in Ahmedabad city. The campus is designed by proper planning and management. Science City has cultivated plants, ornamental plants, and as well as it has a broad area of natural vegetation and common plants which are seen in Ahmedabad so in this place we can observe all types of plants and its habitats. The Science city is far away from central Ahmedabad, it is situated near Sardar Patel ring road, which can consider as the boundary of the city. The study aims to estimate, both natural and planned (by humans) state of the earth’s surface. This science center has both sites, planned as well as a natural state of the land surface. Due to this reason this site was chosen. Figure 2: satellite image of Ahmedabad city and study area Figure 3: Location of Gujarat science city LULC (Land use Land cover) classification through Remote sensing and GIS techniques 1.Satellite image of the study area with high resolution was taken for January 2020 from Google earth pro. 2.The Image was georeferenced by using QGIS 3.4.11. 3.Isocluster unsupervised classification was carried out using ArcGIS 10.4 for Land use Land cover analysis and Scales and apt legends were used to generate Land use Land cover map. 4.For the removal of software-based error, it was checked with a ground survey. Field survey The Field survey was carried out in January 2020 for the formulation of a plant checklist. The survey was carried out around the campus the study area is around 6.495 km2. The Plant checklist included plants that are inside the campus. For the better understanding plants were noted down with its common name, habits such as a tree, herb, or shrub. The photographs of plants were taken for identification with leaves, bark, and flower parts (if available). With the comparison of Filed note information of plant species were used as basic data for plant identification. Plant identification was done with the help of taxonomic experts of the university and institutions, and with the help of literature (Cooke, A.T. 1903, 1985, Shah, 1978) available in the library of the Botany Department, Gujarat University, The Serenity Library, Ahmedabad. Result and Discussion Image analysis Remote sensing and GIS are appropriate techniques for the determination of land use land cover change on the earth’s surface. Satellite data has been used for the identification of Figure 1: Map of India @ IJTSRD | Unique Paper ID – IJTSRD31232 | Volume – 4 | Issue – 4 | May-June 2020 Page 880
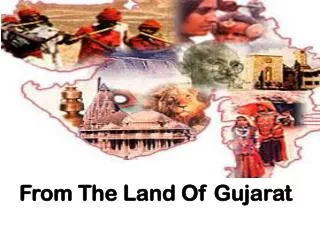
International Journal of Trend in Scientific Research and Development (IJTSRD) @ www.ijtsrd.com eISSN: 2456-6470 global land use land change since 1972 due to its constant availability of images (Hansen and Loveland 2012). This image represents the Iso cluster unsupervised classification. This image illustrates different land-use patterns of the study area. Different colors in the image represent different classes such as open area represents by blue colour, green color shows vegetation area, olive green represents the constructed area and land covered with lawn highlighted by sky blue color. Vegetation covers include small herbs, shrubs as well as trees, cultivated plants (garden plants) also some natural plants. The Constructed area consists of various buildings, roads, and different parks of science center such as life science park, dinosaur park, butterfly park, aquatic gallery, earth dome. Study area classified into four classes: the open area, the vegetation area, the constructed area, and lawn area (land covered with lawn). Unsupervised classification is self-organization data analyses, this method of classification dose not require the primary knowledge of land cover type before classification (J.B campbela et al., 2011, R.O. et al., duda 2009). This method was proceeded by forming maximum clusters. The software identified the pixel itself and generated the cluster, similar clusters form one group. In this image, the land without vegetation and construction considered as open area. Land use Land cover analysis Graph 1 represents land-use patterns of the study area in percentage. This graph concludes four classes which are calculated in percentage, the open area is 18% represented by blue color. The vegetation area is in red up to 52%, the constructed area shown by green color is 27% and the lawn area represented by purple colour is about 3%. Maximum area covered by vegetation and minimum area covered by a lawn of gardens. The information of Land use land cover patterns will help in the future for the formulation and further development of the campus. Graph 1: Represents Land use Land cover in parentage Plant list The List of surveyed plant species of campus indicated a total of 73 species including herb, shrub, grass, climber, sedges, and tree belongs to 44 genera and 32 families Figure 4: unsupervised classification of study area Table 1: List of plants, Local name (Gujarati), Families, Habit. Botanical name Agave Americana Agave capensis gentry Agave joe hoak Agave sisalana perrive Agave angustifolia var. angustifolia Agave desmettiana Jacobi Agave victoriae reginae T. Moore Agave xylonacantha sal m- Dyck Agenolaema marantifolia Blume Agenolaema simplex Blume Allamanda blanchetii A DC Allamanda cathartica L. Allopteropsis cimicina (L.) Stapf Alluaudia procera (Drake) Drake Aloe barbadense Mill Aloe vera (L.) Burm.f. Aloe perryi Baker Aloe aristata Haw. Alysicarpus spp Aralia chinensis L Family Agavaceae Agavaceae Asparagaceae Agavaceae Asparagaceae Asparagaceae Asparagaceae Asparagaceae Araceae Araceae Apocynaceae Apocynaceae Poaceae Didiereaceae Liliaceae Asparagaceae Asparagaceae Xanthorrhoeaceae Fabaceae Araliaceae Habit Shrub Shrub Shrub Shrub Shrub Shrub Shrub Shrub Herb Herb Shrub Shrub Grass Shrub Herb Herb Shrub Herb Herb Shrub @ IJTSRD | Unique Paper ID – IJTSRD31232 | Volume – 4 | Issue – 4 | May-June 2020 Page 881
International Journal of Trend in Scientific Research and Development (IJTSRD) @ www.ijtsrd.com eISSN: 2456-6470 Aralia racemosa L Aralia fruticosa Sesse & Moc. Araucaria columnaris (Forsk.) Hook Bahunia acuminata L. Bauhinia tomentosa L Caladium bicolor (Aiton) Vent Caladium esculentum Vent Caladium hertulanum Bridsey Cannabis sativa L. Carallum crenulata wall. Cardiospermum halicacabum L. Careya arborea Roxb. Cassia grandis L Cassia javanica L Cassia roxburghii DC Cereus jamacaru DC. Cissus quadrangularis L Desmodium gangeticum (L) DC Desmodium scorpiurus (Sw.)Desv. Dioscoriea alata L Elytrophorous spicatus (Wild.)A. Camus Eriocaulon eleanorae Fyson Ficus elastica Roxb. Ex Honem Fimbristylis spp Jacaranda mimosifolia D. Don Mallotus philippensis (Lam.)Mull. Arg. Mammilaria longimam ma DC. Murdania nudiflora L Operculina turpethum(L.)Silva Manso Opuntia elatior Mill Opuntia ficus Opuntia cylindrical (Lam.)DC. Opuntia falcate Ekman & Werderm. Opuntia Microdasys (Leh m.)Pfeiff Opuntia tunicate (Lehm.)Pfeiff. Oryza rufipogon Griff Pachypodium spp Pachypodium lamerei Dr ake Panacratium triflorum Roxb Pandanaus odorifera (Forssk.) Kuntze Passifloria foetida L Pennisetum spp Pentas lanceolata(Forssk.)Deflers Pentatropis capensis(L.f.)Bullock Pergularia daemia (Forssk)Chiov Phyllanthus virgatus G.Forst. Piper longum L Piper betle L. Platycladus orienalis (L.)Franco Yucca aloifolia L inn Yucca pineahele Yucca silverae Zornia gibbosa Span. Araliaceae Araliaceae Araucariaceae Caesalpiniaceae Caesalpiniaceae Araceae Araceae Araceae Cannabaceae Asclepiadaceae Sapindaceae Lecythidaceae Caesalpiniaceae Caesalpiniaceae Caesalpiniaceae Cactaceae Vitacea Fabaceae Fabaceae Dioscorieaceae Poaceae Eriocaulaceae Moraceae Cyperaceae Bignoniaceae Eurphorbiaceae Cactaceae Commelinaceae Convolvulaceae Cactaceae Cactaceae Cactaceae Cactaceae Cactaceae Cactaceae Poaceae Apocynaceae Apocynacea Amaryllidaceae Pandanaceae Passifloraceae Poaceae Rubiaceae Asclepiadaceae Asclepiadaceae Euphorbiceaes Piperaceae Piperaceae Cupressaceae Agavaceae Asparagaceae Asparagaceae Fabaceae Shrub Shrub Tree Tree Tree Herb Herb Herb Herb Shrub Climber Tree Tree Tree Tree Shrub Climber Shrub Climber Climber Grass Herb Tree Sedge Tree Tree Shrub Herb Climber Shrub Shrub Shrub Shrub Shrub Shrub Grass Shrub Shrub Herb Shrub Climber Grass Shrub Climber Climber Herb Climber Climber Tree Shrub Shrub Shrub Herb @ IJTSRD | Unique Paper ID – IJTSRD31232 | Volume – 4 | Issue – 4 | May-June 2020 Page 882
International Journal of Trend in Scientific Research and Development (IJTSRD) @ www.ijtsrd.com eISSN: 2456-6470 Graph analysis of species sinks and decreasing co2 emission by proper Management and planning of land use (Jo. et al., 2001). Pollinators and wild pollinators receive essential resources such as habitat for nesting and food (flower with nectar and pollen) from urban vegetation (Holland et al., 2016). CONCLUSION Drastic use of land and uncontrolled urban growth resulted in a threat to the vegetation of the particular area. It produces destruction of the environment, geological resources, and biological resources. This impact can be examined by using geospatial applications; remote sensing (RS) and geographical information system (GIS). Plants, animals, and insects of urban areas depend on urban habitat for food and shelter, food, especially insects and birds. Urban vegetation captures and filters the PM pollutants from the atmosphere and decreased the disperation of PM pollutants from air (Chen He et al., 2020) additionally trees with large crown with mass of branches and leaves able to decreases the turbulent kinetic energy downwind of trees. Urban vegetation also decreases the NO2 by absorbing it, it is also explored that concentration pf pollutants are lower under trees canopies as compare to in open area (Setala et al., 2013). Urban vegetation habitat can provide condition like natural habitat (Gilbert 1989), which is beneficial for urban biodiversity conservation. It provides shade which can buffer solar radiation, maintain the temperature and moisture during the day as well as block the heat flow during the night. The development and conservation of urban greenery or vegetation, natural and cultivated both are necessary. It is appropriate for human health and also economically beneficial. Ahmedabad city is the rapidly growing city of Gujarat state. Urban sprawl is the major threat to species diversity Particularly in Ahmedabad city. The Strategic process of urban and infrastructure development requires the selection of suitable sites, new approaches, planning, operations, networks, and urban project management. Gardens, parks, institutional campuses are the sources of the greenery in Ahmedabad city. It is a primary need to maintain and develop them. REFERENCES [1]Hasmadi, M. I., Zaki, M. H, Adnan, I. A., Pakhriazad, H. Z., & Fadlli, M. A., “Determining and mapping of vegetation using GIS and phytosociological approach in Mount Tahan, Malaysia”, Journal of Agricultural Science, 2(2), 80, 2010. Graph 2: Species in percentage Graph 3: Species in number ?Graph 2 represents the species in percentage. 44% are shrubs, 21 % herbs, 15% trees, 14% are climbers and only 6 % are grasses. ?Graph 3 represents species in numbers with families, Asparagaceae with 9 Caesalpiniaceae 5, Araceae 5, Apoecynaceae 4, Poaceae 4, and Fabaceae 4. These families are dominant. The major plants are cultivated on this campus as compared to natural plants. This is the state’s most visited science center. Plants are cultivated for ornamentation of campus. Due to this reason, herbs and shrubs are more dominant as compared to trees. Herbs and shrubs are variously used for the beautification of the campus. Vegetation contributes in the removal of air pollutants from the atmosphere via dry deposition and by influencing the smog (O3) process for the improvement of air quality (Bolund, P et al., 1999, Akbari et al., 2001, konopacki et al., 2000, Nowak et al., 1998, Thrones J 2010). the area of leaf surface directly linked with air temperature and air quality, urban trees and other plants of the urban area helps to improve it via reducing air temperature and reduced energy demands for buildings (Akbari et al., 2001) and act as environment filter due to its absorbing capacity of gaseous pollutants on the area of leaf surface (Nowak et al,. 1998). The vegetation of urban regions can impact on carbon dioxide sequestration and climate change mitigation. The municipality can increase carbon species, Cactaceae 8, [2]Day, F. P., Jr and C. D. Monk , “Vegetation patterns on a southern Appalachian watershed”, Ecology 55: 1064- 1074, 1974. [3]Goswami, M., & Khire, M. V, “Land use and land cover change detection for urban sprawl analysis of Ahmedabad city using multitemporal landsat data”, Int J Adv Remote Sens GIS, 5, 1670-1677, 2016. [4]Mohammad, P., Goswami, A., & Bonafoni, S, “The Impact of the Land Cover Dynamics on Surface Urban Heat Island Variations in Semi-Arid Cities: A Case Study in Ahmedabad City, India, Using Multi-Sensor/Source Data” Sensors, 19(17), 3701, 2019. [5]Väre, S., & Rekola, L., Laajat yhtenäiset metsäalueet ekologisen verkoston Uudellamaalla. Uudenmaan liiton julkaisuja E, 87, 53, 2007. osana @ IJTSRD | Unique Paper ID – IJTSRD31232 | Volume – 4 | Issue – 4 | May-June 2020 Page 883
International Journal of Trend in Scientific Research and Development (IJTSRD) @ www.ijtsrd.com eISSN: 2456-6470 [6]González-Oreja, J. A., BOnAChE-REGiDOR, C., & de la Fuente-Díaz, A. A, “Far from the noisy world? Modelling the relationships between park size, tree cover and noise levels in urban green spaces of the city of Puebla, Mexico”, Interciencia, 35(7), 486-492, 2010. [19]Hansen, M. C., and Loveland, T. R, “A review of large area monitoring of land cover change using Landsat data,” Remote sensing of Environment, 122, 66-74, 2012. [20]Bolund, P. (1999). Hunhammar, s. Ecosystem services in urban areas. Ecological Economics, 29, 293-301. [7]Nijland, H. A., Van Kempen, E. E. M. M., Van Wee, G. P., & Jabben, J, “Costs and benefits of noise abatement measures”, Transport policy, 10(2), 131-140, 2003. [21]Akbari, H., & Taha, H, “The impact of trees and white surfaces on residential heating and cooling energy use in four Canadian cities”, Energy, 17(2), 141-149, 1992. [8]Kaplan, R, “The nature of the view from home: Psychological benefits”, Environment behavior, 33(4), 507-542, 2001. and [22]Konopacki, S., & Akbari, H, “Energy savings calculations for heat island reduction strategies in Baton Rouge”, Sacramento and Salt Lake City, 2000. [9]Taylor, A. F., Kuo, F. E., & Sullivan, W. C., Coping with ADD: “The surprising connection to green play settings”, Environment and behavior, 33(1), 54-77, 2001. [23]Nowak, D. J., McHale, P. J., Ibarra, M., Crane, D., Stevens, J. C., & Luley, C. J, “Modeling the effects of urban vegetation on air pollution” In Air pollution modeling and its application XII (pp. 399-407). Springer, Boston, MA, 1998. [10]Van Renterghem, T., Hornikx, M., Forssen, J., & Botteldooren, D, “The potential of building envelope greening to achieve Environment, 61, 34-44, 2013. quietness”,Building and [24]Jo, H. K., & McPherson, E. G, “Indirect carbon reduction by residential vegetation and planting strategies in Chicago”, USA. Journal Management, 61(2), 165-177, 2001. [11]Ulrich, R, "View through a window may influence recovery”, Science, 224(4647), 224-225, 1984. of Environmental [12]Van den Berg, A. E., Maas, J, “Verheij, R. A., & Groenewegen, P. P, Green space as a buffer between stressful life events and health”, Social science & medicine, 70(8), 1203-1210, 2010. [25]Holland, J. M., Bianchi, F. J., Entling, M. H., Moonen, A. C., Smith, B. M., & Jeanneret, P, “Structure, function and management of semi-natural habitats for conservation biological control: a review of European studies”, Pest management science, 72(9), 1638-1651, 2016. [13]Redon, E., Lemonsu, A., & Masson, V, “An urban trees parameterization for modeling microclimatic variables and thermal comfort conditions at street level with the Town Energy Balance v8.0)”, Geoscientific Model Development, 13(2), 385- 399, 2020. [26]J.B. Campbell, and R.H. Wynne, “Introduction to Remote Sensing”, Guilford Press: New York, NY, USA, 2011; Vol. 5. model (TEB-SURFEX [27] R.O. Duda, P.E. Hart, and D.G. Stork, “Pattern Classification and Scene Analysis Part 1: Pattern Classification”; Wiley: Chichester, UK, 2000. [14]Cooke, A.T 1903, 1958. The Flora of the president of Bombay, Vol. I-III, Botanical survey of India, Calcutta. [28]He, C., Qiu, K., Alahmad, A., & Pott, R, “Particulate matter capturing capacity of roadside evergreen vegetation during the winter season” Urban Forestry & Urban Greening, 48, 126510, 2020. [15]Shah, G.L. 1978. Flora of Gujarat State. [16]Prajapati, B.K. (2018). Checklist of floweing plants of Ahmedabad district. M.Sc. Thesis, Gujarat university, Ahmedabad. [29]Setälä, H., Viippola, V., Rantalainen, A. L., Pennanen, A., & Yli-Pelkonen, V, “Does urban vegetation mitigate air pollution in northern conditions?”, Environmental Pollution, 183, 104-112, 2013. [17]Raghavan, R. S., Wadhwa, B. M., Ansari, M. Y., & Rao, R. S. (1981). checklist of the plants of Gujarat. Records- Botanical Survey of India. [30]Gillbert, O. L,”The ecology of urban habitats–Chapman & Hall”, London/New York, 1-369, 1989. [18]Sudhira, H. S., Ramachandra, T. V., and Jagadish, K. S, “Urban sprawl: metrics, dynamics and modelling using GIS,” International Journal Observation and Geoinformation, 5(1), 29-39, 2004. of Applied Earth @ IJTSRD | Unique Paper ID – IJTSRD31232 | Volume – 4 | Issue – 4 | May-June 2020 Page 884