Download
1 / 3
30 likes | 43 Views
Securities and futures is a general course for undergraduates in the university, which plays an important role in cultivating students ability to analyze and solve problems. It not only helps teachers to know and master the distribution of students performance accurately, but also helps teachers to improve the quality of teaching. SPSS is an analytical software used to carry out statistical analysis. Using SPSS and descriptive analysis method, the paper makes a reasonable evaluation of the final grade based on the data of the final grade of the students securities and futures. The paper gets the correlation coefficient value of students final grade and usual performance, judges the correlation between them, builds regression equation by using correlation analysis and regression analysis, and then make a reasonable prediction of students final grade in the future. Chen Rong "Analysis and Prediction of the Final Grade of Securities and Futures Based on SPSS" Published in International Journal of Trend in Scientific Research and Development (ijtsrd), ISSN: 2456-6470, Volume-4 | Issue-4 , June 2020, URL: https://www.ijtsrd.com/papers/ijtsrd30879.pdf Paper Url :https://www.ijtsrd.com/other-scientific-research-area/other/30879/analysis-and-prediction-of-the-final-grade-of-securities-and-futures-based-on-spss/chen-rong<br>

E N D
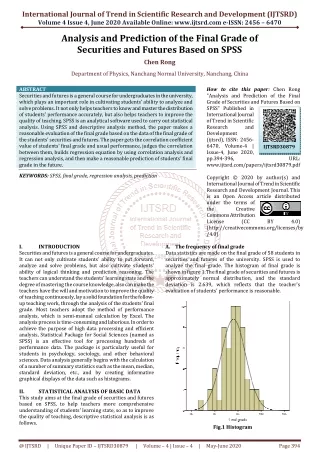
International Journal of Trend in Scientific Research and Development (IJTSRD) Volume 4 Issue 4, June 2020 Available Online: www.ijtsrd.com e-ISSN: 2456 – 6470 Analysis and Prediction of the Final Grade of Securities and Futures Based on SPSS Chen Rong Department of Physics, Nanchang Normal University, Nanchang, China ABSTRACT Securities and futures is a general course for undergraduates in the university, which plays an important role in cultivating students' ability to analyze and solve problems. It not only helps teachers to know and master the distribution of students' performance accurately, but also helps teachers to improve the quality of teaching. SPSS is an analytical software used to carry out statistical analysis. Using SPSS and descriptive analysis method, the paper makes a reasonable evaluation of the final grade based on the data of the final grade of the students' securities and futures. The paper gets the correlation coefficient value of students' final grade and usual performance, judges the correlation between them, builds regression equation by using correlation analysis and regression analysis, and then make a reasonable prediction of students' final grade in the future. KEYWORDS: SPSS, final grade, regression analysis, prediction How to cite this paper: Chen Rong "Analysis and Prediction of the Final Grade of Securities and Futures Based on SPSS" Published in International Journal of Trend in Scientific Research and Development (ijtsrd), ISSN: 2456- 6470, Volume-4 | Issue-4, June 2020, pp.394-396, www.ijtsrd.com/papers/ijtsrd30879.pdf Copyright © 2020 by author(s) and International Journal of Trend in Scientific Research and Development Journal. This is an Open Access article distributed under the terms of the Creative Commons Attribution License (CC (http://creativecommons.org/licenses/by /4.0) A.The frequency of final grade Data statistics are made on the final grade of 58 students in securities and futures of the university. SPSS is used to analyze the final grade. The histogram of final grade is shown in figure 1.The final grade of securities and futures is approximately normal distribution, and the standard deviation is 2.639, which reflects that the teacher's evaluation of students' performance is reasonable. IJTSRD30879 URL: BY 4.0) I. Securities and futures is a general course for undergraduates. It can not only cultivate students' ability to put forward, analyze and solve problems, but also cultivate students' ability of logical thinking and prediction reasoning. The teachers can understand the students' learning state and the degree of mastering the course knowledge, also can make the teachers have the will and motivation to improve the quality of teaching continuously, lay a solid foundation for the follow- up teaching work, through the analysis of the students' final grade. Most teachers adopt the method of performance analysis, which is semi-manual calculation by Excel. The analysis process is time-consuming and laborious. In order to achieve the purpose of high data processing and efficient analysis, Statistical Package for Social Sciences (named as SPSS) is an effective tool for processing hundreds of performance data. The package is particularly useful for students in psychology, sociology, and other behavioral sciences. Data analysis generally begins with the calculation of a number of summary statistics such as the mean, median, standard deviation, etc., and by creating informative graphical displays of the data such as histograms. II. STATISTICAL ANALYSIS OF BASIC DATA This study aims at the final grade of securities and futures based on SPSS, to help teachers more comprehensive understanding of students' learning state, so as to improve the quality of teaching, descriptive statistical analysis is as follows. INTRODUCTION Fig.1 Histogram @ IJTSRD | Unique Paper ID – IJTSRD30879 | Volume – 4 | Issue – 4 | May-June 2020 Page 394
International Journal of Trend in Scientific Research and Development (IJTSRD) @ www.ijtsrd.com eISSN: 2456-6470 B.The mean value and standard deviation of final grade The data statistics of the final grade of securities and futures are carried out, and descriptive statistics such as minimum value, maximum value, mean value and standard deviation are constructed. SPSS is used for statistical analysis, as shown in table. The results show that the total number of samples is 58, the highest score is 100,the lowest score is 87,the mean value of samples is 94.02,and the standard deviation of samples is 2.639,which indicates that there is a certain deviation among samples. TABLE I DESCRIPTION STATISTICS N Minimum value Maximum value Mean value Standard deviation Final Grade 58 87 Valid n (list status) 58 III. REGRESSION ANALYSIS OF PERFORMANCE There are many factors that affect the final grade of students, such as students' usual performance, teaching quality of teachers, students' ability to learn knowledge, etc. In order to study the influence of students' usual performance on the final grade,carry out regression analysis of the final grade based on the usual performance. A.Correlation analysis As can be seen from table, the correlation coefficient between the usual performance and the final grade as two variables is 0.364 at the 0.01 significance level (bilateral), which is between 0 and 1.This indicates that the usual performance and the final grade are positive correlation and weak correlation. TABLE II CORRELATION Pearson correlation Significance (bilateral) N Pearson correlation Significance (bilateral) N **. There was a significant correlation at. 01 level (bilateral). B.Regression analysis In order to better study the influence of students' usual performance on the final grade, regression analysis was carried out on the two variables of usual performance and final grade. According to table Ⅲ, the input method is adopted, the independent variable is the usual performance, and the dependent variable is the final grade. We can see from table Ⅳ that the correlation coefficient r value between the two variables of the usual performance and the final grade is 0.364, which indicates that the correlation between the two variables is not high. The value of the coefficient R2 is 0.133,which means that the usual performance can only explain 13.3% of the final grade. In other words, the accuracy of using the usual performance to predict the final grade is only 13.3%, the model is accurate, the regression effect is significant, and the model fitting degree is relatively high. Table Ⅴ shows the statistical test results of the model, and the analysis of variance is used. It is known that F= 8.555, P = 0.005 < 0.05.So the regression model is statistically significant, that is to say, the regression equation is effective. It can be seen that there is a linear correlation between the usual performance and the final grade. Table Ⅵ shows the coefficients of the constructed model. The coefficients of the regression equation are estimated. The estimated value of constant a is 82.819,and the estimated value of regression coefficient b1 is 0.244.A linear regression model of one variable can be obtained. The model equation is as follows. ∧ 819 . 82 ∧ Y is the predicted final grade.The final grade will be increased by 0.244 points for every 1 point increase in usual performance. TABLE III INPUT VARIABLESREMOVED VARIABLES Model Input variable Removed variables Method 1 usual performance a a. All requested variables have been entered. b. Dependent variable: final grade TABLE IV MODEL SUMMARY Model R R2 Adjust R2 Error of standard estimation Durbin-Watson 1 .364a .133 .117 a. Forecast variable: (constant), usual performance. b. Dependent variable: final grade 100 94.02 2.639 Usual performance Final grade 1 58 .364** .005 58 .364** .005 58 1 58 Usual performance Final grade = + × . 0 244 Y X Where, X is the usual performance and input 2.480 1.876 @ IJTSRD | Unique Paper ID – IJTSRD30879 | Volume – 4 | Issue – 4 | May-June 2020 Page 395
International Journal of Trend in Scientific Research and Development (IJTSRD) @ www.ijtsrd.com eISSN: 2456-6470 TABLE V ANOVA Sum of squares 52.609 344.374 396.983 a. Forecast variable: (constant), usual performance. b. Dependent variable: final grade TABLE VI COEFFICIENT Non standardized coefficient Standard coefficient B Standard error 82.819 3.843 usual performance .244 a. Dependent variable: final grade Model regression residual Total df 1 56 57 mean square 52.609 6.150 F Sig. 8.555 .005a 1 Model Trial version .364 t Sig (constant) 21.553 .000 2.925 1 .083 .005 IV. THE EVALUATION AND PREDICTION OF FINAL GRADE Descriptive analysis of the final grade of securities and futures shows that the final grade of students is approximately normal distribution.The mean value of 58 students is 94.02 and the standard deviation is 2.639, which shows that the distribution of students' performance is reasonable and the deviation is relatively small. Taking the usual performance and final grade are as two variables, the correlation coefficient of the two variables is 0.364,which is not high. Taking the final grade and the usual performance as the dependent and independent variables, the regression analysis of the two variables shows that there is a linear correlation between them, the regression effect is significant, and the fitting degree of the model is relatively high. V. CONCLUSION The analysis of final grade is an organic part of education. The analysis, measurement, evaluation and prediction of final grade should be the necessary ability of every teacher. Combined with specific data from descriptive analysis, correlation analysis and regression analysis, SPSS was used to analyze the final grade. Teachers can not only better understand the current state of students' learning, but also predict the unknown grades through analyzing the data of final grades. The prediction results are reasonable and reliable. Therefore, the coefficient of the regression equation is estimated and the linear regression equation of one variable is obtained. The regression equation can be used to predict the final grade of the students. ACKNOWLEDGMENT Project supported by the research on teaching reform of Nanchang Normal University(Grant No.JGKT-19-12),also by the research on science and technology of Nanchang Normal University(Grant No.18KJYB05). REFERENCES [1]Sanaa Rasheed Muhesin, Abbas Fadhil Salih. A Statistical Analysis of Organizational Performance and its Impact on Income Levels: an Exploratory Study by the Al-Nahrain University in the Diagnosis of Infertility and Assisted Reproductive Technology. 2020, 2(3) [2]Herber R, Kaiser A, Grählert X, Range U, Raiskup F, Pillunat L E, Spörl E. Statistical analysis of correlated measurement data in ophthalmology : Tutorial for the application of the linear mixed model in SPSS and R using corneal biomechanical parameters[J]. Der Ophthalmologe: Zeitschrift Ophthalmologischen Gesellschaft,2020,117(1). der Deutschen [3]Hongchao Wu, Shaoping Qiu, Larry M. Dooley, et al. The Relationship between Challenge and Hindrance Stressors and Emotional Exhaustion: The Moderating Role of Perceived Servant Leadership. 2019, 17(1) [4]Aung Cho, Khin Khin Lay. Applied SPSS for Business and Marketing. 2019, 3(4) @ IJTSRD | Unique Paper ID – IJTSRD30879 | Volume – 4 | Issue – 4 | May-June 2020 Page 396