Download
1 / 3
30 likes | 48 Views
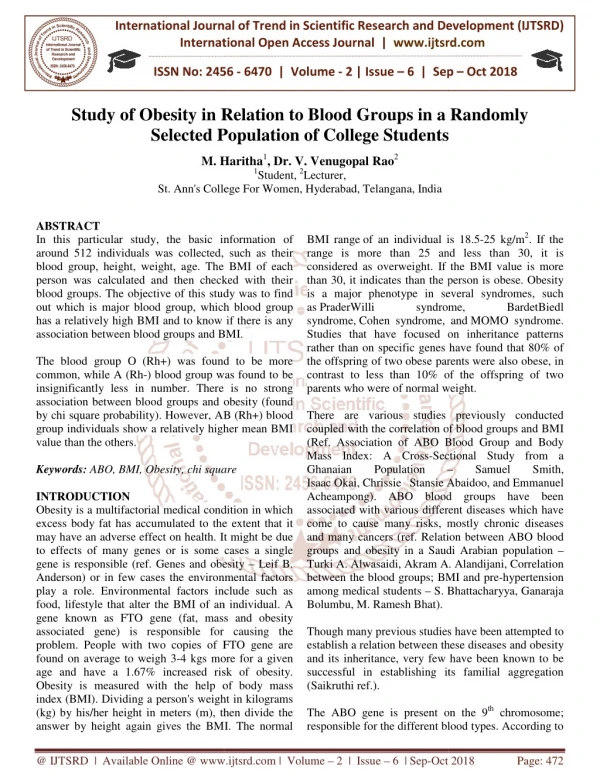
In this particular study, the basic information of around 512 individuals was collected, such as their blood group, height, weight, age. The BMI of each person was calculated and then checked with their blood groups. The objective of this study was to find out which is major blood group, which blood group has a relatively high BMI and to know if there is any association between blood groups and BMI. The blood group O Rh was found to be more common, while A Rh blood group was found to be insignificantly less in number. There is no strong association between blood groups and obesity found by chi square probability . However, AB Rh blood group individuals show a relatively higher mean BMI value than the others. M. Haritha | Dr. V. Venugopal Rao "Study of Obesity in Relation to Blood Groups in a Randomly Selected Population of College Students" Published in International Journal of Trend in Scientific Research and Development (ijtsrd), ISSN: 2456-6470, Volume-2 | Issue-6 , October 2018, URL: https://www.ijtsrd.com/papers/ijtsrd18487.pdf Paper URL: http://www.ijtsrd.com/biological-science/other/18487/study-of-obesity-in-relation-to-blood-groups-in-a-randomly-selected-population-of-college-students/m-haritha<br>

E N D
International Journal of Trend in International Open Access Journal International Open Access Journal | www.ijtsrd.com International Journal of Trend in Scientific Research and Development (IJTSRD) Research and Development (IJTSRD) www.ijtsrd.com ISSN No: 2456 ISSN No: 2456 - 6470 | Volume - 2 | Issue – 6 | Sep 6 | Sep – Oct 2018 Study of Obesity in Relatio Selected Population Selected Population of College Students Relation to Blood Groups in a College Students Randomly M. Haritha Haritha1, Dr. V. Venugopal Rao2 1Student, 2Lecturer, St. Ann's College For Women, Hyderabad, Telangana, India St. Ann's College For Women, Hyderabad ABSTRACT In this particular study, the basic information of around 512 individuals was collected, such as their blood group, height, weight, age. The BMI of each person was calculated and then checked with their blood groups. The objective of this study was to find out which is major blood group, which blood group has a relatively high BMI and to know if there is any association between blood groups and BMI. The blood group O (Rh+) was found to be more common, while A (Rh-) blood group was found to be insignificantly less in number. There is no strong association between blood groups and obesity (found by chi square probability). However, AB (Rh+) blood group individuals show a relatively higher mean BMI value than the others. Keywords:ABO, BMI, Obesity, chi square INTRODUCTION Obesity is a multifactorial medical condition in which excess body fat has accumulated to the extent that it may have an adverse effect on health. It might be due to effects of many genes or is some cases a single gene is responsible (ref. Genes and obesity Anderson) or in few cases the environmental factors play a role. Environmental factors include such as food, lifestyle that alter the BMI of an individual. A gene known as FTO gene (fat, mass and obesity associated gene) is responsible for causing the problem. People with two copies of FTO gene are found on average to weigh 3-4 kgs more for a given age and have a 1.67% increased risk of obesity. Obesity is measured with the help of index (BMI). Dividing a person's weight in kilograms (kg) by his/her height in meters (m), then divide the answer by height again gives the BMI. The normal answer by height again gives the BMI. The normal BMI range of an individual is 18.5 range is more than 25 and less than 30, it is considered as overweight. If the BMI value is more than 30, it indicates than the person is obese. Obesity is a major phenotype in several syndromes, such as PraderWilli syndrome syndrome, Cohen syndrome, and Studies that have focused on inheritance patterns rather than on specific genes have found that 80% of the offspring of two obese parents contrast to less than 10% of the offspring of two parents who were of normal weight. There are various studies previously conducted coupled with the correlation of blood groups and BMI (Ref. Association of ABO Blo Mass Index: A Cross-Sectional Study from a Ghanaian Population Isaac Okai, Chrissie Stansie Abaidoo Acheampong). ABO blood groups have been associated with various different diseases which have come to cause many risks, mostly chronic diseases and many cancers (ref. Relation between ABO blood groups and obesity in a Saudi Arabian population Turki A. Alwasaidi, Akram A. Alandijani, Correlation between the blood groups; BMI and pre among medical students – S. Bhattacharyya, Ganaraja Bolumbu, M. Ramesh Bhat). Though many previous studies have been attempted to establish a relation between these diseases and obesity and its inheritance, very few have been known to be successful in establishing its familial aggregation (Saikruthi ref.). The ABO gene is present on the 9 responsible for the different blood types. According to responsible for the different blood types. According to of an individual is 18.5-25 kg/m2. If the range is more than 25 and less than 30, it is considered as overweight. If the BMI value is more than 30, it indicates than the person is obese. Obesity henotype in several syndromes, such Willi syndrome, In this particular study, the basic information of around 512 individuals was collected, such as their ght, weight, age. The BMI of each person was calculated and then checked with their blood groups. The objective of this study was to find out which is major blood group, which blood group has a relatively high BMI and to know if there is any tween blood groups and BMI. BardetBiedl , and MOMO syndrome. Studies that have focused on inheritance patterns rather than on specific genes have found that 80% of obese parents were also obese, in contrast to less than 10% of the offspring of two parents who were of normal weight. The blood group O (Rh+) was found to be more ) blood group was found to be insignificantly less in number. There is no strong association between blood groups and obesity (found probability). However, AB (Rh+) blood group individuals show a relatively higher mean BMI There are various studies previously conducted coupled with the correlation of blood groups and BMI (Ref. Association of ABO Blood Group and Body Sectional Study from a ABO, BMI, Obesity, chi square – – Abaidoo, and Emmanuel Samuel Smith, ). ABO blood groups have been associated with various different diseases which have come to cause many risks, mostly chronic diseases lation between ABO blood groups and obesity in a Saudi Arabian population – Turki A. Alwasaidi, Akram A. Alandijani, Correlation between the blood groups; BMI and pre-hypertension medical condition in which to the extent that it may have an adverse effect on health. It might be due to effects of many genes or is some cases a single Genes and obesity – Leif B. Anderson) or in few cases the environmental factors tal factors include such as food, lifestyle that alter the BMI of an individual. A gene known as FTO gene (fat, mass and obesity associated gene) is responsible for causing the problem. People with two copies of FTO gene are Bhattacharyya, Ganaraja Though many previous studies have been attempted to establish a relation between these diseases and obesity and its inheritance, very few have been known to be successful in establishing its familial aggregation gs more for a given age and have a 1.67% increased risk of obesity. Obesity is measured with the help of body mass (BMI). Dividing a person's weight in kilograms (kg) by his/her height in meters (m), then divide the on the 9th chromosome; @ IJTSRD | Available Online @ www.ijtsrd.com www.ijtsrd.com | Volume – 2 | Issue – 6 | Sep-Oct 2018 Oct 2018 Page: 472
International Journal of Trend in Scientific Research and Development (IJTSRD) ISSN: 2456 in Scientific Research and Development (IJTSRD) ISSN: 2456 in Scientific Research and Development (IJTSRD) ISSN: 2456-6470 RESULTS Mean/Relative BMI 1.AB– ve = 21.15 2.A – ve = 21.90 3.B – ve = 22.93 4.O – ve = 22.12 5.AB + ve = 23.44 6.A + ve = 23.22 7.B + ve = 23.27 8.O + ve = 22.81 some previous reports, there are certain antigens present that monitor the food habits in individuals. ABO antigen has been reported to be a risk factor for cardiovascular & infectious diseases, allergies and some cancers (ref. Blood group, hypertension, and obesity in the student population of northeast bosnia and herzegovina Edina Hajdarević, Snježana Hodžić, Emir Aldijana Avdić, Mirela Habibović). Over the past five decades, blood grouping have acquired immense importance, the reason being the reported association of ABO groups and certain diseases. However, a full association is yet to be established scientifically. METHODOLOGY As this is a study based survey, a questionnaire has been prepared which consisted of several questions briefing about the individuals’ name, age, height, weight, BMI and blood group (ref. A research on relationship between ABO blood groups and body mass index among Turkish seafarers – Nas S, et al. Int Marit Health 2017). After the information has been gathered the major blood group in the survey is checked for. Chi square analysis is utilized to understand if there is any relation between blood groups and obesity. squared test, also written as χ2 test, is any hypothesis test where the sampling distribution test statistic is a chi-squared distribution squared test is used to determine whet significant difference between frequencies and the observed frequencies in one or more categories. The observed values are the values that are known to us. The expected value can be calculated as Expected value = ??? ????? ? ?????? Chi square analysis is done using the formula Chi square analysis is done using the formula some previous reports, there are certain antigens present that monitor the food habits in individuals. ABO antigen has been reported to be a risk factor for ectious diseases, allergies and Blood group, hypertension, and obesity in the student population of northeast bosnia – Amela Amela Hercegovac, ć, Emir Halilović, . Over the past five decades, blood grouping have acquired immense the reported association Blood group distribution Observed Value Normal 60 Underweight Overweight 19 Obese Column Total 93 Blood group distribution table of ABO groups and certain diseases. However, a full association is yet to be established scientifically. Row Total 283 65 139 27 514 A B AB O 91 18 51 12 172 10 6 8 2 26 122 32 61 8 223 udy based survey, a questionnaire has been prepared which consisted of several questions briefing about the individuals’ name, age, height, weight, BMI and blood group (ref. A research on relationship between ABO blood groups and body 9 5 172 Nas S, et al. Int Degrees of freedom = (4-1) x (4-1) Degrees of freedom = (4 = 3 x 3 = 9 = 3 x 3 = 9 Marit Health 2017). After the information has been gathered the major blood group in the survey is Expected Value Normal Underweight 11.76 21.75 Overweight Obese A B B AB O Chi square analysis is utilized to understand if there is any relation between blood groups and obesity. A chi- 51.2 94.7 94.7 21.75 46.51 9.03 14.31 122.78 3.28 7.03 1.36 28.2 60.3 11.71 , is any statistical 25.14 46.51 4.88 sampling distribution of the squared distribution The chi- 9.03 squared test is used to determine whether there is a significant difference between frequencies and the observed frequencies in one or more categories. The observed values are the values that are known to us. The expected value can be χ2=(OBSERVED-EXPECTED) 2/EXPECTED A B 1.51 0.14 0.64 0.646 1.499 0.433 0.0029 0.976 Total (χ2) EXPECTED) the the expected expected 2/EXPECTED AB 1.298 2.25 0.133 0.3 O 0.14 0.646 0.433 0.976 0.005 0.51 0.008 1.17 ?????? ????? ? 3.6519 2.195 2.195 3.981 1.693 χ2 = 3.6519 + 2.195 + 3.981 + 1.693 = 3.6519 + 2.195 + 3.981 + 1.693 = 11.5209 Rh distribution table Rh distribution table ??????? That is, Χ2 = ∑????????? ?????????????? X2 follows the χ2 distribution with k − 1 freedom. Degrees of Freedom = (no. of rows – columns – 1). Observed ValueRh +Ve Normal Underweight Overweight Obese Column Total Rh -VeRow Total 13 4 4 0 13 ???????? ????? 271 63 132 27 298 284 67 136 27 514 − 1 degrees of – 1) x (no. of @ IJTSRD | Available Online @ www.ijtsrd.com www.ijtsrd.com | Volume – 2 | Issue – 6 | Sep-Oct 2018 Oct 2018 Page: 473
International Journal of Trend in Scientific Research and Development (IJTSRD) ISSN: 2456 in Scientific Research and Development (IJTSRD) ISSN: 2456 in Scientific Research and Development (IJTSRD) ISSN: 2456-6470 blood groups and obesity. Same is the case with the Rh antigen. The degrees of freedom in the Rh distribution table are 3. The predictable table value is 7.81; the calculated value is very much higher indicating significant effect of Rh on obesity (chi square value with probability). blood groups and obesity. Same is the case with the Rh antigen. The degrees of freedom in the Rh distribution table are 3. The predictable table value is 7.81; the calculated value is very much higher indicating significant effect of Rh on obesit square value with probability). Conclusion ?There is no strong association between blood groups and obesity. ?However, when individual group values are compared AB blood group is showing the highest value of χ2 (3.981), which could indicate the of A and B antigens together in influencing the obesity. ?When the mean/relative BMI values are analyzed, AB positive group mean is showing highest value (23.44) amongst all the groups. ?Major blood group seen in the survey is O (Rh +ve) blood group (ref. groups and BMI Evaluation among school students of Tiruchirappalli, Tamil Nadu Soundarya N., Suganthi Palani, Ramachandran. N., Jothi.N.) ?Rh locus is found to influence obesity significantly. EXPECTED VALUERh +ve NORMAL UNDERWEIGHT OVERWEIGHT OBESE Rh -ve 7.18 1.69 3.43 0.68 164.65 38.84 78.84 15.65 Degrees of freedom = (2 – 1) x (4 = 1 x 3 = 3 χ2=(OBSERVED-EXPECTED)2/EXPECTED TOTAL(χ2) χ2 = 59.737 + 8.6487 = 68.3857 1) x (4 – 1) There is no strong association between blood EXPECTED)2/EXPECTED Rh +ve 0.646 15.02 35.84 8.231 59.737 Rh -ve 4.717 3.157 0.0947 0.68 8.6487 However, when individual group values are compared AB blood group is showing the highest (3.981), which could indicate the role of A and B antigens together in influencing the When the mean/relative BMI values are analyzed, AB positive group mean is showing highest value amongst all the groups. Major blood group seen in the survey is O (Rh 68.3857 Discussion According to the percentage point’s chi square distribution table, taking the probability of and degrees of freedom as 9, the predictable table value is 16.92. If the calculated chi square value is greater than the hypothetical value, then the assumptious association is not held true. deduced that there is no proper association deduced that there is no proper association between Distribution of Blood point’s chi square groups and BMI Evaluation among school students of Tiruchirappalli, Tamil Nadu – Soundarya N., Suganthi Palani, Ramachandran. distribution table, taking the probability of χ2 as 0.05 and degrees of freedom as 9, the predictable table value is 16.92. If the calculated chi square value is greater than the hypothetical value, then the sumptious association is not held true. Hence it is Rh locus is found to influence obesity @ IJTSRD | Available Online @ www.ijtsrd.com www.ijtsrd.com | Volume – 2 | Issue – 6 | Sep-Oct 2018 Oct 2018 Page: 474