Download
1 / 5
50 likes | 66 Views
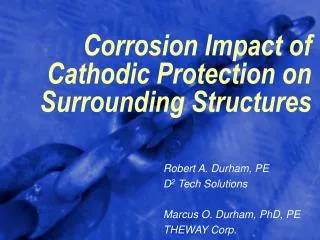
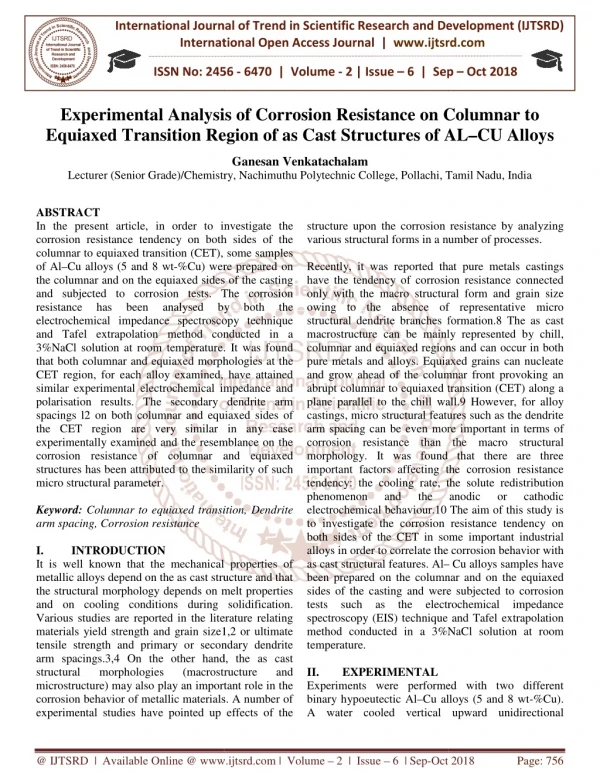
In the present article, in order to investigate the corrosion resistance tendency on both sides of the columnar to equiaxed transition CET , some samples of AlCu alloys 5 and 8 wt Cu were prepared on the columnar and on the equiaxed sides of the casting and subjected to corrosion tests. The corrosion resistance has been analysed by both the electrochemical impedance spectroscopy technique and Tafel extrapolation method conducted in a 3 NaCl solution at room temperature. It was found that both columnar and equiaxed morphologies at the CET region, for each alloy examined, have attained similar experimental electrochemical impedance and polarisation results. The secondary dendrite arm spacings l2 on both columnar and equiaxed sides of the CET region are very similar in any case experimentally examined and the resemblance on the corrosion resistance of columnar and equiaxed structures has been attributed to the similarity of such micro structural parameter. Ganesan Venkatachalam "Experimental Analysis of Corrosion Resistance on Columnar to Equiaxed Transition Region of as Cast Structures of ALCU Alloys" Published in International Journal of Trend in Scientific Research and Development (ijtsrd), ISSN: 2456-6470, Volume-2 | Issue-6 , October 2018, URL: https://www.ijtsrd.com/papers/ijtsrd18733.pdf Paper URL: http://www.ijtsrd.com/chemistry/other/18733/experimental-analysis-of-corrosion-resistance-on-columnar-to-equiaxed-transition-region-of-as-cast-structures-of-al:-cu-alloys/ganesan-venkatachalam<br>

E N D
International Journal of Trend in International Open Access Journal International Open Access Journal | www.ijtsrd.com International Journal of Trend in Scientific Research and Development (IJTSRD) Research and Development (IJTSRD) www.ijtsrd.com ISSN No: 2456 ISSN No: 2456 - 6470 | Volume - 2 | Issue – 6 | Sep 6 | Sep – Oct 2018 Experimental Analysis Equiaxed Transition Region of a Equiaxed Transition Region of as Cast Structures of AL Experimental Analysis of Corrosion Resistance on Columnar to on Columnar to f AL–CU Alloys Ganesan Venkatachalam Lecturer (Senior Grade)/Chemistry, Nachimuthu Polytechnic College, (Senior Grade)/Chemistry, Nachimuthu Polytechnic College, Pollachi, Tamil Nadu Tamil Nadu, India ABSTRACT In the present article, in order to investigate the corrosion resistance tendency on both sides of the columnar to equiaxed transition (CET), some samples of Al–Cu alloys (5 and 8 wt-%Cu) were the columnar and on the equiaxed sides of the casting and subjected to corrosion tests. The corrosion resistance has been analysed electrochemical impedance spectroscopy technique and Tafel extrapolation method conducted in a 3%NaCl solution at room temperature. It was found that both columnar and equiaxed morphologies at the CET region, for each alloy examined, have attained similar experimental electrochemical impedance and polarisation results. The secondary dendrite arm spacings l2 on both columnar and equiaxed sides of the CET region are very similar in any case experimentally examined and the resemblance on the corrosion resistance of columnar and equiaxed structures has been attributed to the similarity of such micro structural parameter. Keyword: Columnar to equiaxed transition, Dendrite arm spacing, Corrosion resistance I. INTRODUCTION It is well known that the mechanical properties of metallic alloys depend on the as cast structure and that the structural morphology depends on melt properties and on cooling conditions during solidification. Various studies are reported in the literature materials yield strength and grain size1,2 or ultimate tensile strength and primary or secondary dendrite arm spacings.3,4 On the other hand, the as cast structural morphologies microstructure) may also play an important role corrosion behavior of metallic materials. A number of experimental studies have pointed up effects of the structure upon the corrosion resistance by analyzing various structural forms in a number of processes. Recently, it was reported that pure have the tendency of corrosion resistance connected only with the macro structural form and grain size owing to the absence of representative micro structural dendrite branches formation.8 The as cast macrostructure can be mainly represent columnar and equiaxed regions and can occur in both pure metals and alloys. Equiaxed grains can nucleate and grow ahead of the columnar front provoking an abrupt columnar to equiaxed transition (CET) along a plane parallel to the chill wall.9 castings, micro structural features such as the dendrite arm spacing can be even more important in terms of corrosion resistance than the macro structural morphology. It was found that there are three important factors affecting the corr tendency: the cooling rate, the solute redistribution phenomenon and the electrochemical behaviour.10 The aim of this study is to investigate the corrosion resistance tendency on both sides of the CET in some important i alloys in order to correlate the corrosion behavior with as cast structural features. Al– been prepared on the columnar and on the equiaxed sides of the casting and were subjected to corrosion tests such as the electrochemi spectroscopy (EIS) technique and Tafel extrapolation method conducted in a 3%NaCl solution at room temperature. II. EXPERIMENTAL Experiments were performed with two different binary hypoeutectic Al–Cu alloys (5 and 8 wt A water cooled vertical upward unidirectional In the present article, in order to investigate the corrosion resistance tendency on both sides of the columnar to equiaxed transition (CET), some samples structure upon the corrosion resistance by analyzing various structural forms in a number of processes. %Cu) were prepared on Recently, it was reported that pure metals castings have the tendency of corrosion resistance connected only with the macro structural form and grain size owing to the absence of representative micro structural dendrite branches formation.8 The as cast macrostructure can be mainly represented by chill, columnar and equiaxed regions and can occur in both pure metals and alloys. Equiaxed grains can nucleate and grow ahead of the columnar front provoking an abrupt columnar to equiaxed transition (CET) along a plane parallel to the chill wall.9 However, for alloy castings, micro structural features such as the dendrite arm spacing can be even more important in terms of corrosion resistance than the macro structural morphology. It was found that there are three important factors affecting the corrosion resistance tendency: the cooling rate, the solute redistribution phenomenon and the electrochemical behaviour.10 The aim of this study is to investigate the corrosion resistance tendency on both sides of the CET in some important industrial alloys in order to correlate the corrosion behavior with the columnar and on the equiaxed sides of the casting and subjected to corrosion tests. The corrosion resistance has been analysed electrochemical impedance spectroscopy technique and Tafel extrapolation method conducted in a solution at room temperature. It was found that both columnar and equiaxed morphologies at the CET region, for each alloy examined, have attained similar experimental electrochemical impedance and polarisation results. The secondary dendrite arm l2 on both columnar and equiaxed sides of the CET region are very similar in any case experimentally examined and the resemblance on the corrosion resistance of columnar and equiaxed structures has been attributed to the similarity of such by by both both the the anodic anodic or or cathodic cathodic Columnar to equiaxed transition, Dendrite It is well known that the mechanical properties of metallic alloys depend on the as cast structure and that the structural morphology depends on melt properties and on cooling conditions during solidification. Various studies are reported in the literature relating materials yield strength and grain size1,2 or ultimate tensile strength and primary or secondary dendrite arm spacings.3,4 On the other hand, the as cast structural morphologies microstructure) may also play an important role in the corrosion behavior of metallic materials. A number of experimental studies have pointed up effects of the – Cu alloys samples have been prepared on the columnar and on the equiaxed sides of the casting and were subjected to corrosion tests such as the electrochemical impedance spectroscopy (EIS) technique and Tafel extrapolation method conducted in a 3%NaCl solution at room (macrostructure (macrostructure and and Experiments were performed with two different Cu alloys (5 and 8 wt-%Cu). vertical upward unidirectional @ IJTSRD | Available Online @ www.ijtsrd.com www.ijtsrd.com | Volume – 2 | Issue – 6 | Sep-Oct 2018 Oct 2018 Page: 756
International Journal of Trend in Scientific Research and Development (IJTSRD) ISSN: 2456 International Journal of Trend in Scientific Research and Development (IJTSRD) ISSN: 2456 International Journal of Trend in Scientific Research and Development (IJTSRD) ISSN: 2456-6470 solidification system was used to obtain the samples of Al–Cu alloys. The water cooled system was designed in such a way that the heat was extracted only through the water cooled bottom, promoting upward vertical directional solidification. The used experimental set-up is schematically shown in Fig. 1. up is schematically shown in Fig. 1. solidification system was used to obtain the samples Cu alloys. The water cooled system was designed in such a way that the heat was extracted only through the water cooled bottom, promoting al solidification. The used Fig 2 a macrostructure representation at CET and b average values of secondary dendrite arm spacing l2 for Al–5 wt-%Cu and Al The samples were positioned at the glass corrosion cell kit, leaving a circular 1 cm2 metal surf contact with the electrolyte. The potential amplitude was set to 10 mV in open circuit potential and the frequency range was set from 100 mHz to 100 kHz. EIS measurements began after an initial delay of 30 min for the sample to reach a steady state Polarisation tests were also conducted in a 500 mL 3%NaCl solution at room temperature using an EG & G Princeton Applied Research, model 273 A potentiostat. The polarisation tests were conducted by stepping the potential at a scan rate of 0. 2 m from 2250 (SCE) to z250 mV (SCE) related to open circuit potential. The polarisation curves were plotted, and both corrosion rate and potential were estimated by the Tafel extrapolation method after obtaining triplicate experimental results. All the tests were performed after each correspondent EIS test. Fig 2 a macrostructure representation at CET and b average values of secondary dendrite arm spacing l2 %Cu and Al–8 wt-%Cu alloys The samples were positioned at the glass corrosion cell kit, leaving a circular 1 cm2 metal surface in contact with the electrolyte. The potential amplitude was set to 10 mV in open circuit potential and the frequency range was set from 100 mHz to 100 kHz. EIS measurements began after an initial delay of 30 min for the sample to reach a steady state condition. Polarisation tests were also conducted in a 500 mL 3%NaCl solution at room temperature using an EG & G Princeton Applied Research, model 273 A potentiostat. The polarisation tests were conducted by stepping the potential at a scan rate of 0. 2 mV s21 from 2250 (SCE) to z250 mV (SCE) related to open circuit potential. The polarisation curves were plotted, and both corrosion rate and potential were estimated by the Tafel extrapolation method after obtaining triplicate experimental results. All the polarisation tests were performed after each correspondent EIS Fig 1 Water cooled vertical upward unidirectional solidification apparatus Cylindrical as cast specimens were longitudinally sectioned from the centre in order to reveal macrostructure and microstructure. processing system Neophot 32 and Cambridge Leica 500 was used to measure the average dendrite arm spacing at the CET region. Figure 2 shows a schematic representation of the CET region (Fig. 2a) and a table with mean values of secondary dendrite arm spacing l2 measured in both sides of the CET region for each alloy experimentally examined (Fig. 2b). In order to estimate the tendency of corrosion resistance for the different alloys at the CET region, EIS tests were conducted in a 500 mL 3%NaCl solution at room temperature. A potentiostat coupled to a frequency analyser system, a glass corrosion cell kit with a platinum counter electrode and a saturated calomel reference electrode (SCE) were used, as prescribed by the ASTM standard G3/89. The working electrodes consisted of as cast alloys samples. The as cast samples were further ground up to a 600 grit SiC paper, followed by distilled water washing and air drying before each sequence of the EIS and polarisation tests. Fig 1 Water cooled vertical upward unidirectional Cylindrical as cast specimens were longitudinally sectioned from the centre in order to reveal both the macrostructure and microstructure. processing system Neophot 32 and Cambridge Leica- 500 was used to measure the average dendrite arm spacing at the CET region. Figure 2 shows a schematic representation of the CET region (Fig. 2a) ble with mean values of secondary dendrite arm spacing l2 measured in both sides of the CET region for each alloy experimentally examined (Fig. An An image image In order to estimate the tendency of corrosion resistance for the different alloys at the CET region, tests were conducted in a 500 mL 3%NaCl solution at room temperature. A potentiostat coupled to a frequency analyser system, a glass corrosion cell kit with a platinum counter electrode and a saturated calomel reference electrode (SCE) were used, as ibed by the ASTM standard G3/89. The working electrodes consisted of as cast alloys samples. The as cast samples were further ground up to a 600 grit SiC paper, followed by distilled water washing and air drying before each sequence of the Fig 3 Columnar to equiaxed transition of Al–5 wt- Fig 3 Columnar to equiaxed transition of Al %Cu directionally solidified sample %Cu directionally solidified sample @ IJTSRD | Available Online @ www.ijtsrd.com www.ijtsrd.com | Volume – 2 | Issue – 6 | Sep-Oct 2018 Oct 2018 Page: 757
International Journal of Trend in Scientific Research and Development (IJTSRD) ISSN: 2456 International Journal of Trend in Scientific Research and Development (IJTSRD) ISSN: 2456 International Journal of Trend in Scientific Research and Development (IJTSRD) ISSN: 2456-6470 III. Figure 3 shows a typical example of the directionally solidified macrostructure of an Al–5 wt The CET is observed to occur essentially on a near vertical plane and far from the metal/chill interface. The secondary dendrite arm spacing's were measured in both sides of the CET. Figure 4 shows a comparison of experimental results for these two Al Cu alloys concerning EIS diagrams and potentio dynamic polarization curves in both morphologies at the CET vicinity. The EIS experimental results are presented in both Bode representations, as shown in Fig. 4a and c. In the EIS diagrams shown in Figs. 4a and c, the high frequency limit (f.1 kHz) corresponds to the electrolyte resistance Rel. RESULTS AND DISCUSSION RESULTS AND DISCUSSION Figure 3 shows a typical example of the directionally 5 wt-%Cu alloy. The CET is observed to occur essentially on a near vertical plane and far from the metal/chill interface. The secondary dendrite arm spacing's were measured in both sides of the CET. Figure 4 shows a perimental results for these two Al– Cu alloys concerning EIS diagrams and potentio dynamic polarization curves in both morphologies at the CET vicinity. The EIS experimental results are presented in both Bode and and . 4a and c. In the EIS Bode Bode phase phase diagrams shown in Figs. 4a and c, the high frequency limit (f.1 kHz) corresponds to the electrolyte Fig 4 Comparison between experimental EIS and potentio dynamic polarization curves of a and b Al wt-%Cu alloy and c and d Al– sides of columnar to equiaxed transition The low frequency limit (f,1 Hz) indicates the sum of Rel. and the resistance R1, which is, in a first approximation, the polarization resistance of the material surface.11 The Bode phase or phase angle h against log f plot shows h dropping towards zero at high and low frequencies, corresponding to the resistive behavior of Rel. and the sum of Rel. plus R1. Figure 5 shows the resulting corrosion rate values ICorr as a function of secondary dendrite arm spacing l2 for Al–5 wt-%Cu and Al–8 wt be observed that both columnar and equiaxed morphologies at the CET region for the Al alloy castings exhibit lower corrosion rates than those morphologies of the Al–5 wt behavior seems to be associated with differences on micro structural features, which are known to play an important role in the Hypoeutectic Al–Cu as cast alloys are constituted by Fig 4 Comparison between experimental EIS and potentio dynamic polarization curves of a and b Al–5 –8 wt-%Cu alloy on both sides of columnar to equiaxed transition The low frequency limit (f,1 Hz) indicates the sum of Rel. and the resistance R1, which is, in a first approximation, the polarization resistance of the .11 The Bode phase or phase angle h against log f plot shows h dropping towards zero at high and low frequencies, corresponding to the resistive behavior of Rel. and the sum of Rel. plus R1. Figure 5 shows the resulting corrosion rate values ction of secondary dendrite arm spacing 8 wt-%Cu alloys. It can be observed that both columnar and equiaxed morphologies at the CET region for the Al–8 wt-%Cu alloy castings exhibit lower corrosion rates than those 5 wt-%Cu alloy. Such behavior seems to be associated with differences on structural features, which are known to play an important role in the Cu as cast alloys are constituted by corrosion corrosion resistance. resistance. @ IJTSRD | Available Online @ www.ijtsrd.com www.ijtsrd.com | Volume – 2 | Issue – 6 | Sep-Oct 2018 Oct 2018 Page: 758
International Journal of Trend in Scientific Research and Development (IJTSRD) ISSN: 2456 International Journal of Trend in Scientific Research and Development (IJTSRD) ISSN: 2456 International Journal of Trend in Scientific Research and Development (IJTSRD) ISSN: 2456-6470 an Al rich dendritic matrix a involved by a lamellar eutectic mixture formed by a and Al2Cu lamellae. The amount of Al2Cu inside the interdendritic region is quite close for both alloys experimentally examined (Al–5Cu and Al–8Cu), but the secondary dendritic arm spacing is ,50% higher for the former alloy as can be seen in Fig. 5. As a general trend, the secondary arm spacing decreases with increasing solute content of hypoeutectic alloys. atrix a involved by a lamellar fit experimental data for the different analysed alloys is shown in Fig. 6. The impedance parameters Rel., R1, ZCPE and n were evaluated using an appropriate model (ZView version 2.1b) and are presented in Table 1. It can be observed in Figs. 4 and 5 and Table 1 that both columnar and equiaxed morphologies at the CET region for the two examined Al–Cu alloys have attained similar experimental EIS and potentio dynamic polarization results. For the Al–5 wt-%Cu alloy, it can be seen that the current density and corrosion potential for both columnar and equiaxed morphologies around the CET region are about 5. 08 and 4. 82 mA cm22 and 2584 and 2620 mV respectively. Average secondary dendrite arm spacing's l2 in both columnar and equiaxed sides at the CET region are similar, as shown in Fig. 4b. The polarisation resistance R1, capacitances values ZCPE and phase angle n values are also similar for both columnar and equiaxed morphologies around the CET fit experimental data for the different analysed alloys is shown in Fig. 6. The impedance parameters Rel., R1, ZCPE and n were evaluated using an appropriate model (ZView version 2.1b) a Table 1. It can be observed in Figs. 4 and 5 and Table 1 that both columnar and equiaxed morphologies at the CET region for the two examined Al have attained similar experimental EIS and potentio dynamic polarization results. alloy, it can be seen that the current density and corrosion potential for both columnar and equiaxed morphologies around the CET region are about 5. 08 and 4. 82 mA cm22 and 2584 and 2620 mV respectively. Average secondary dendrite arm spacing's l2 in both columnar and equiaxed sides at the CET region are similar, as shown in Fig. 4b. The polarisation resistance R1, capacitances values ZCPE and phase angle n values are also similar for both columnar and equiaxed morphologies around the region. For the Al–8 wt-%Cu alloy, the current density and corrosion potential for both columnar and equiaxed morphologies around the CET region are about 3. 89 and 3. 69 mA cm22 and 2581 and 2597 mV respectively. The mean l2 values are also very similar, as shown in Fig. 4d. In Table 1, the ZCPE, n and R1 values indicate similarity on the corrosion resistance tendency at both sides of the CET. eutectic mixture formed by a and Al2Cu lamellae. The amount of Al2Cu inside the interdendritic region is quite close for both alloys experimentally examined 8Cu), but the secondary dendritic higher for the former alloy as can be seen in Fig. 5. As a general trend, the secondary arm spacing decreases with increasing solute content %Cu alloy, the current density and corrosion potential for both columnar and equiaxed morphologies around the CET region are about 3. 89 and 3. 69 mA cm22 and 2581 and 2597 mV respectively. The mean l2 values are also very ar, as shown in Fig. 4d. In Table 1, the ZCPE, n and R1 values indicate similarity on the corrosion resistance tendency at both sides of the CET. Fig 5 Corrosion rate ICorr as function of secondary dendrite arm spacing l2 for Al–5 wt-%Cu and Al wt-%Cu alloys and typical microstructures The literature reports that inter metallic particles such as Al2Cu dissolves faster than the dendritic matrix when immersed in some aggressive environment.13 In the lamellar eutectic morphology, the close to the inter metallic that it acts as a barrier to corrosion of such particles. This seems to be more effective for smaller dendritic spacing's because a more extensive distribution of the ‘protective barrier’ will be provided. This reasoning could explain the experimental evidence shown in Fig. 4. The frequency range (1 Hz,f,1 kHz) is determined by the capacitance C. In the mathematical analysis of impedance diagrams, a constant phase element (CPE) was used instead of an ‘ideal’ capacitor to account for the deviations observed as capacities slopes and phase angle reach values lower than 21 and 90u respectively. The parameter n, which is shown in Table 1, defines values that when approaching 1, the constant ZCPE is identical to an ideal c reported in literature.11 The equivalent circuit used to reported in literature.11 The equivalent circuit used to Fig 5 Corrosion rate ICorr as function of secondary %Cu and Al–8 %Cu alloys and typical microstructures The literature reports that inter metallic particles such as Al2Cu dissolves faster than the dendritic matrix when immersed in some aggressive environment.13 In the lamellar eutectic morphology, the a phase is so close to the inter metallic that it acts as a barrier to corrosion of such particles. This seems to be more effective for smaller dendritic spacing's because a more extensive distribution of the ‘protective barrier’ Fig 6 Equivalent circuit for modeling impedance data of examined alloys Fig 6 Equivalent circuit for modeling impedance data of examined alloys soning could explain the experimental evidence shown in Fig. 4. The frequency range (1 Hz,f,1 kHz) is determined by the capacitance C. In the mathematical analysis of impedance diagrams, a constant phase element (CPE) was used Analysing Table 1, although a variation can be observed among the impedance parameters ZCPE and R1 of both alloys, it can be seen that a same order of magnitude is attained because the observed variation can be considered irrelevant. For instance, a 103 order of magnitude is kept for all polarisation resistance Analysing Table 1, although a variation can be observed among the impedance parameters ZCPE and R1 of both alloys, it can be seen that a same order of magnitude is attained because the observed variation can be considered irrelevant. For instance, a 103 or of magnitude is kept for all polarisation resistance values: 3. 7, 4. 8, 3. 4 and 3. 2 kV cm22 . Thus, the values: 3. 7, 4. 8, 3. 4 and 3. 2 kV cm22 . Thus, the or to account for the deviations observed as capacities slopes and phase lower than 21 and 90u respectively. The parameter n, which is shown in Table 1, defines values that when approaching 1, the constant ZCPE is identical to an ideal capacitor, as @ IJTSRD | Available Online @ www.ijtsrd.com www.ijtsrd.com | Volume – 2 | Issue – 6 | Sep-Oct 2018 Oct 2018 Page: 759
International Journal of Trend in Scientific Research and Development (IJTSRD) ISSN: 2456 International Journal of Trend in Scientific Research and Development (IJTSRD) ISSN: 2456 International Journal of Trend in Scientific Research and Development (IJTSRD) ISSN: 2456-6470 sole remaining factor of influence seems to be n, which indicates the phase angle. Further, the experimental fits simulated using the ZView versi 2.1b show that a minimum variation of n can provide a considerable modification on corrosion resistance tendency, with higher values indicating better corrosion behaviour, as observed for the Al %Cu alloy. The equivalent circuit results are in agreement with the current density values obtained from the potentio dynamic curves. It is important to point out that the present experimental results are limited to general corrosion. The adopted procedure to determine corrosion rates takes into account eith active or non-active (nobler) surface areas. As a result, corrosion rates were determined considering the whole area. IV. CONCLUSION The following conclusions can be drawn from the present experimental investigation: 1.The experimental EIS results in both Bode and Bode phase representations and Tafel polarisation results for both columnar and equiaxed sides of the CET regions have indicated a great similarity in terms of corrosion resistance for any alloy experimentally examined, despite the more sole remaining factor of influence seems to be n, which indicates the phase angle. Further, the experimental fits simulated using the ZView version 2.1b show that a minimum variation of n can provide a considerable modification on corrosion resistance tendency, with higher values indicating better corrosion behaviour, as observed for the Al–8 wt- %Cu alloy. The equivalent circuit results are in ement with the current density values obtained from the potentio dynamic curves. It is important to point out that the present experimental results are limited to general corrosion. The adopted procedure to determine corrosion rates takes into account either active (nobler) surface areas. As a result, corrosion rates were determined considering extensive grain boundaries distribution typical of equiaxed structures. 2.The dendrite arm spacing seems to be the most significant structural parameter in terms of corrosion resistance because they are similar on both sides of the CET for each alloy examined, despite the dissimilarity of macrostructure. 3.The corrosion resistance has decreased with increasing alloy Cu content. The experimental evidence has indicated that this can be associated with smaller dendritic arm spacings. REFERENCES 1.N. J. Petch: J. Iron Steel Inst., 1953, 174, 25 31. 2.A. Lasalmonie and J. Strudel: J. Mater. Sci., 1986, 21, 1837–1852. 3.P. Donelan: Mater. Sci. Technol., 2000, 16, 261 269. 4.W. R. Oso´ rio, C. A. Santos, J. M. V. Quaresma and A. Garcia: J. Mater. P 143, 703–709. 5.I. Garcia and J. J. de Damborenea: Corros. Sci., 1998, 40, 1411–1419. extensive grain boundaries distribution typical of The dendrite arm spacing seems to be the most significant structural parameter in terms of corrosion resistance because they are similar on e CET for each alloy examined, despite the dissimilarity of macrostructure. The corrosion resistance has decreased with increasing alloy Cu content. The experimental evidence has indicated that this can be associated with smaller dendritic arm spacings. N. J. Petch: J. Iron Steel Inst., 1953, 174, 25 31. A. Lasalmonie and J. Strudel: J. Mater. Sci., 1986, P. Donelan: Mater. Sci. Technol., 2000, 16, 261– The following conclusions can be drawn from the W. R. Oso´ rio, C. A. Santos, J. M. V. Quaresma J. Mater. Process. Technol., 2003, The experimental EIS results in both Bode and Bode phase representations and Tafel polarisation results for both columnar and equiaxed sides of the CET regions have indicated a great similarity in terms of corrosion resistance for any alloy examined, despite the more I. Garcia and J. J. de Damborenea: Corros. Sci., @ IJTSRD | Available Online @ www.ijtsrd.com www.ijtsrd.com | Volume – 2 | Issue – 6 | Sep-Oct 2018 Oct 2018 Page: 760