Download
1 / 3
40 likes | 67 Views
The purpose of this work is to understand the importance and impact of service quality on customer satisfaction in selected small stores in 3 cities of Mongolia using SERVQUAL and GAP models. The paper also discusses various models of service quality and attempts to assess their relative importance for the successful measurement of service quality. Weighted average values and analysis of variance are used in inappropriate places for a critical research of customer perceptions of service quality, which ultimately will help to obtain information about the growth of efficiency of organized small outlets. Buzmaa Bayarsaikhan | Bayarmaa Baasanbat | Ariuntuya Erdenebaatar "Effect of Small Stores Service Quality on Customer Satisfaction" Published in International Journal of Trend in Scientific Research and Development (ijtsrd), ISSN: 2456-6470, Volume-4 | Issue-1 , December 2019, URL: https://www.ijtsrd.com/papers/ijtsrd29449.pdf Paper URL: https://www.ijtsrd.com/management/business-ethics-and-legal-issues/29449/effect-of-small-stores-service-quality-on-customer-satisfaction/buzmaa-bayarsaikhan<br>

E N D
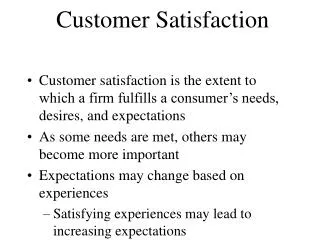
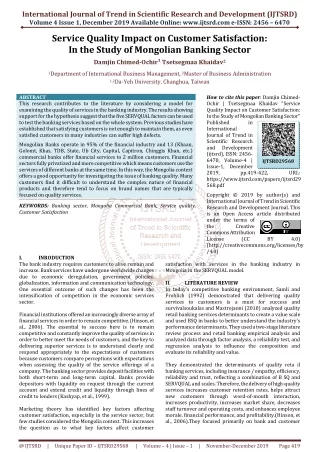
International Journal of Trend in Scientific Research and Development (IJTSRD) Volume 4 Issue 1, December 2019 Available Online: www.ijtsrd.com e-ISSN: 2456 – 6470 Effect of Small Stores Service Quality on Customer Satisfaction Buzmaa Bayarsaikhan1, Bayarmaa Baasanbat2, Ariuntuya Erdenebaatar3 1Department of Human Resource and Public Relations, 2Department of International Business Management, 1,2Da-Yeh University, Changhua, Taiwan 3Department of Economist, Finance and Economist University, Ulaanbaatar, Mongolia ABSTRACT The purpose of this work is to understand the importance and impact of service quality on customer satisfaction in selected small stores in 3 cities of Mongolia using SERVQUAL and GAP models. The paper also discusses various models of service quality and attempts to assess their relative importance for the successful measurement of service quality. Weighted average values and analysis of variance are used in inappropriate places for a critical research of customer perceptions of service quality, which ultimately will help to obtain information about the growth of efficiency of organized small outlets. KEYWORDS: Small stores, service quality, costomer satisfaction, Mongolia How to cite this paper: Buzmaa Bayarsaikhan | Bayarmaa Baasanbat | Ariuntuya Erdenebaatar "Effect of Small Stores Service Quality on Customer Satisfaction" Published in International Journal of Trend in Scientific Research and Development (ijtsrd), ISSN: 2456- 6470, Volume-4 | Issue-1, December 2019, pp.808-810, URL: www.ijtsrd.com/papers/ijtsrd29449.pdf Copyright © 2019 by author(s) and International Journal of Trend in Scientific Research and Development Journal. This is an Open Access article distributed under the terms of the Creative Commons Attribution License (CC (http://creativecommons.org/licenses/by /4.0) IJTSRD29449 BY 4.0) 1.INRODUCTION The small Mongolian industry has become one of the most dynamic and fastest-growing industries due to the emergence of several new players. It accounts for more than 20% of the country's gross domestic product (GDP) and about 15% of employment. The industry has a long way to go since there are enormous opportunities for optimizing the sector. The small sector of Mongolia is gradually approaching to become another boom industry. Small sectors will include food and food, clothing, electronics, e- commerce, fashion and lifestyle. Currently, Mongolia accounts for only 8% of the organized small, and the remaining 92% remains unorganized, which can grow much faster than the traditional small. It is expected that he will receive a large share in the growing pie of a small market in Mongolia. According to various estimates, by 2020 the share of organized smallness will be 20%. Quality of service is an essential component of a customer’s perception of a service. Customers perceive services in terms of their quality and how generally they are satisfied with their experience (Zeithaml, 1988). Thus, quality of service is defined as the perception by customers of how much a service meets or exceeds their expectations (Czepiel, 1990). In a small context, the perception of encounters with services builds up over time, and the client’s relationship with the organization depends on continued exchange or interaction in the present or future (Czepiel, 1990). When customers value small services, they compare their perceptions of the services they receive based on their expectations. Customers are satisfied when the perceived service meets or exceeds their expectations and vice versa. Thus, in small services, it is necessary to look at quality in terms of services as well as goods and obtain a set of elements that accurately measure this design (Mehta, 2000). For this reason, Dabholkar et al. (1996) developed and empirically adopted the Small Service Quality Scale (RSQS) to capture the dimensions of important small customers based on a qualitative triangulation study using three different methodologies: phenomenological interviews, in- depth interviews and store-based customer tracking. Combining these quality results with existing literature and SERVQUAL, Dabholkar et al. (1996) suggested that the quality of small services has a hierarchical structure of factors that includes five main dimensions, namely, the physical aspects of “reliability”, “personal interaction”, “problem solving” and “politics”, with the first three main dimensions having two Sub-dimensions everyone and the overall quality of service as a good ordering factor. Suliman (2013) in his study of the main parameters of the SERVQUAL model and its influence on the level of customer satisfaction found that the main parameters of the SERVQUAL model affect the level of customer satisfaction at @ IJTSRD | Unique Paper ID – IJTSRD29449 | Volume – 4 | Issue – 1 | November-December 2019 Page 808
International Journal of Trend in Scientific Research and Development (IJTSRD) @ www.ijtsrd.com eISSN: 2456-6470 different levels. The study talks about the need to constantly improve the services provided to customers by studying consumer behavior and working to predict customer expectations to ensure the provision of better services (Boshoff et al., 1997). Rakesh (2012), in his study, “Evaluating the Quality of the Banking Industry Using SERVQUAL,” found that service managers are under increasing pressure to demonstrate that their services are customer-oriented and that continuous productivity improvements are being made. Given the financial and resource constraints that service organizations must manage, it is important that customer expectations are correctly understood and measured, and that any gaps in service quality are identified from the customer’s point of view (Kim, 2002; Parikh et al., 2006). Amiri & Fagani (2012) in their studies of service quality and customer satisfaction (by using SERVQUAL model) examined the relationship between service strategies and customer satisfaction and examined the quality of mobile banking services provided by banks in Iran. The researcher used customer satisfaction as a dependent variable and five dimensions of service quality; namely, material values, reliability, responsiveness, confidence and empathy, as independent variables (Kumar, 2011). Research continued on measurement, data collection procedure, data analysis, etc., on the issues of quality of service, which led to the creation of a reliable base for the researcher to conduct this study. 2.Methodology Data collection was carried out using a questionnaire based on the SERVQUAL model. A random sampling method has been used. Respondents are customers visiting Reliance Fresh and Spencer Small. The sample size is 300 respondents. 30 stores in 3 Mongolian cities, namely, Ulan Bator, Darkhan and Erdenet, were randomly selected for research. GAP scores in SERVQUAL were analyzed and ranked. 2.1.Service Quality Models The researcher in this study examines the following service models in light of the changing business scenario. Models are presented using a standard structure, i.e. cover a brief discussion and basic model observations for the above parameters. 2.2.SERVQUAL Evaluation The following table shows customer perceptions with reference to various statements made to determine the SERVQUAL metric for 5 SERVQUAL dimensions. 2.3.GAP Evaluation for Reliance and Spencer The highest value of 1500, i.e. (300 × 5 (totally agree)), is assigned to measure expectations, and the rating is compared with the rating of perception obtained in Table 1. the definition, modeling, 3.Resulrs From the study, the analysis focuses on five aspects of service quality using the GAP model. Measurements of materiality, reliability, responsiveness, confidence and empathy were combined with all three small companies in selected cities. The gap score was calculated during the study, and weighted averages were integrated to monitor service quality gaps in individual cities. Table 1 GAP score for reliance retail and spencer retail From tables 1 and 2 it can be seen that in relation to the measurement of "tangibility", the average gap score (-734.25) is much higher than the average SERVQUAL score (-594.78). Therefore, it has been observed that most Reliance customers believe that the measurement of material qualities should be improved. In addition, it is clear that the functions of a small retail outlet are @ IJTSRD | Unique Paper ID – IJTSRD29449 | Volume – 4 | Issue – 1 | November-December 2019 Page 809
International Journal of Trend in Scientific Research and Development (IJTSRD) @ www.ijtsrd.com eISSN: 2456-6470 not visually attractive, and the staff at the reception of small retail outlets do not look neat. Whereas customers believe that a small outlet is equipped with modern equipment, and materials (such as brochures and brochures) are available as an effective source of information for the client. Table 2 Relative ranking of the quality dimensions concentrate on features that are visually appealing to customers. In addition, it is also recommended that the staff of the small retail outlet at the front desk be fair and tidy to attract customers and that customers can freely exchange the necessary information with the front desk staff. Reliance of small retail outlets should be focused on providing customer-friendly information on customer requests and problems. Regarding the response aspect, a small company should train employees to be more responsible for providing information about the services that can be provided to customers. In addition, employees should be prepared to help customers. Small retail outlets should ensure customer confidence in security, and small retail outlets should provide the best listening interest in order to show more empathy for customers. Reference [1]Amiri, A.S.F., Faghani, F. (2012), Service quality and customer satisfaction (application of SERVQUAL model). International Journal of Management and Business Research, 2(4), 351-361. With reference to the Reliability measurement, the average gap score (-527.4) is lower than the average SERVQUAL score (-594.78). Consequently, it is observed that most Reliance customers feel that reliability measurement is up to standard. In addition, it is clear that when smaller promises do something by a certain time, they do it, and they perform service for the first time, and they also insist on error-free transactions. But when a client has a problem, this is not perceived as a serious solution to the problem. Therefore, this can become a disadvantage for the company and reduce the quality of service, which will lead to customer dissatisfaction. Regarding the measurement of responsiveness, the average gap score (-547.75) is lower than the average SERVQUAL score (-594.78). Consequently, it is observed that most Reliance customers consider responsiveness to be effective. In addition, it is clear that employees in a small store quickly attempt to request and inquire customers, which is a good sign of a service relationship. But there is a lack of informing the client about the exact time of completion of the transaction, and his willingness to help clients is not impressive, which leads to the fact that the client does not visit a small outlet. Regarding the “collateral” measurement, the average gap score (-477.5) is lower than the average SERVQUAL score (- 594.78). Consequently, it is observed that most Reliance customers believe that measuring trust is quite effective. In addition, it is clear that the behavior of employees instills confidence in customers, as well as a high level of knowledge of employees, which leads to a positive opinion of customers. On the other hand, there is no politeness and convenience for the client in terms of safety and reliability, which can lead to loss of customers in the long term. Regarding the “Empathy” measurement, the average gap score (-687) is higher than the average SERVQUAL score (- 594.78). Consequently, it has been observed that most Reliance customers believe that empathy affects lesser quality of service. In addition, it is clear that hours of operation are not so convenient, and employees lack service and customer assistance, which reduces the opinion of less, which leads to dissatisfaction. But the results of the survey show that employees show the best interest at heart, and they are always ready to listen, and they clearly understand what customers need and ask with individual attention. This leads to customer interest in shopping, and also helps to make positive reinforcements to visit the store again. Conclusion Based on the analysis of the number of SERVQUAL trust points, it is recommended that small Reliance points [2]Boshoff, C., Terblanche, N.S. (1997), Measuring small service quality: Areplication research. South African Journal of Business Management, 28(4), 123-128. [3]Czepiel, J. (1990), Service encounters and service relationships: Implications for research. Journal of Business Research, 20(1), 13-21. [4]Dabholkar, P.A. (1996), Consumer evaluations of new technology-based self-service investigation of alternative models. International Journal of Research in Marketing, 13, 29-51. operations: An [5]Kim, J. (2002), Service quality in the Thai telecommunication industry: Atool for achieving a sustiable competitive Decision, 40, 693-701. advantage. Management [6]Kumar, S.S., Kumar, S.P. (2011), Growing prospective of small ındustry in and around India. Advances in Management, 4(2), 58-62. [7]Mehta, E. (2000), A service quality model based on ideal value standard. International Journal of Service Industry Management, 3(3), 18-33. [8]Parikh, D. (2006), Measuring small service quality: An empirical assessment of the ınstrument. Vikalpa Management Journal, 31, 45-52. [9]Rakesh, R. (2012), Quality assessment of banking ındustry using the SERVQUAL model. Indian Streams Research Journal, 2(2), 1-4. [10]Sulieman, A. (2013), Basic dimensions of the SERVQUAL model and its ımpact on the level of customer satisfaction. European Business Review, 22, 5-24. [11]Zeithaml, V.A. (1988), Consumer perception of price, quality, and value: Ameans-end model and synthesis of evidence. Journal of Marketing, 52(3), 2-22. @ IJTSRD | Unique Paper ID – IJTSRD29449 | Volume – 4 | Issue – 1 | November-December 2019 Page 810