Download
1 / 5
50 likes | 74 Views
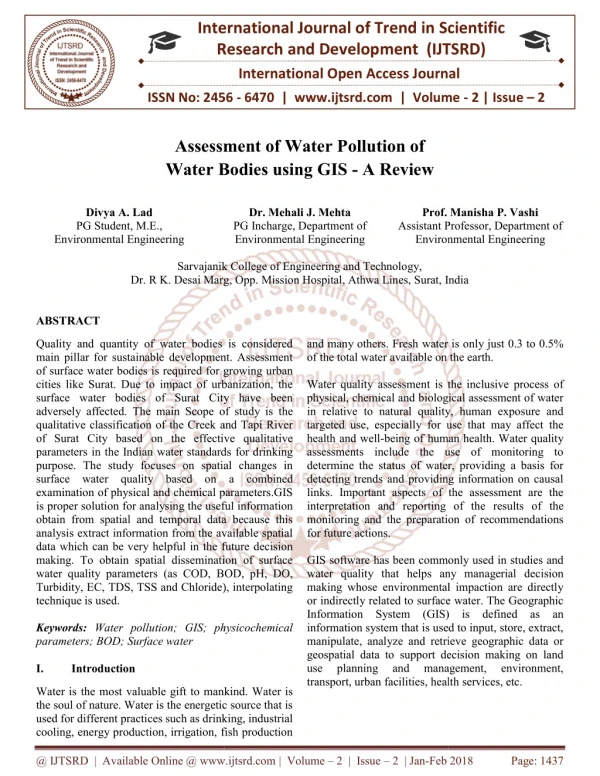
Quality and quantity of water bodies is considered main pillar for sustainable development. Assessment of surface water bodies is required for growing urban cities like Surat. Due to impact of urbanization, the surface water bodies of Surat City have been adversely affected. The main Scope of study is the qualitative classification of the Creek and Tapi River of Surat City based on the effective qualitative parameters in the Indian water standards for drinking purpose. The study focuses on spatial changes in surface water quality based on a combined examination of physical and chemical parameters.GIS is proper solution for analysing the useful information obtain from spatial and temporal data because this analysis extract information from the available spatial data which can be very helpful in the future decision making. To obtain spatial dissemination of surface water quality parameters as COD, BOD, pH, DO, Turbidity, EC, TDS, TSS and Chloride , interpolating technique is used. Divya A. Lad | Dr. Mehali J. Mehta | Prof. Manisha P. Vashi "Assessment of Water Pollution of Water Bodies using GIS - A Review" Published in International Journal of Trend in Scientific Research and Development (ijtsrd), ISSN: 2456-6470, Volume-2 | Issue-2 , February 2018, URL: https://www.ijtsrd.com/papers/ijtsrd10706.pdf Paper URL: http://www.ijtsrd.com/engineering/environment-engineering/10706/assessment-of-water-pollution-of-water-bodies-using-gis---a-review/divya-a-lad<br>

E N D
International Research Research and Development (IJTSRD) International Open Access Journal ssessment of Water Pollution of Water Bodies using GIS - A Review International Journal of Trend in Scientific Scientific (IJTSRD) International Open Access Journal ISSN No: 2456 ISSN No: 2456 - 6470 | www.ijtsrd.com | Volume 6470 | www.ijtsrd.com | Volume - 2 | Issue – 2 Assessment of Water Pollution of Water Bodies Divya A. Lad PG Student, M.E., Environmental Engineering Dr. Mehali J. Mehta PG Incharge, Department of Environmental Engineering Sarvajanik College of Engineering and Technology, Prof. Manisha P. Vashi Assistant Professor, Department of Environmental Engineering Environmental Engineering Prof. Manisha P. Vashi Professor, Department of Sarvajanik College of Engineering and Technology, Dr. R K. Desai Marg, Opp. Dr. R K. Desai Marg, Opp. Mission Hospital, Athwa Lines, Surat, India ission Hospital, Athwa Lines, Surat, India ABSTRACT Quality and quantity of water bodies is considered main pillar for sustainable development. Assessment of surface water bodies is required for growing urban cities like Surat. Due to impact of urbanization, the surface water bodies of Surat City have been adversely affected. The main Scope of study is the qualitative classification of the Creek and Tapi River of Surat City based on the effective qualitative parameters in the Indian water standards for drinking purpose. The study focuses on spatial changes in surface water quality based on a examination of physical and chemical parameters.GIS is proper solution for analysing the useful information obtain from spatial and temporal data because this analysis extract information from the available spatial data which can be very helpful in the future decision making. To obtain spatial dissemination of surface water quality parameters (as COD, BOD, pH, DO, Turbidity, EC, TDS, TSS and Chloride), interpolating technique is used. Keywords: Water pollution; GIS; physicochemical parameters; BOD; Surface water I. Introduction Quality and quantity of water bodies is considered main pillar for sustainable development. Assessment ter bodies is required for growing urban cities like Surat. Due to impact of urbanization, the surface water bodies of Surat City have been adversely affected. The main Scope of study is the qualitative classification of the Creek and Tapi River ity based on the effective qualitative parameters in the Indian water standards for drinking purpose. The study focuses on spatial changes in surface water quality based on a combined examination of physical and chemical parameters.GIS for analysing the useful information obtain from spatial and temporal data because this analysis extract information from the available spatial data which can be very helpful in the future decision making. To obtain spatial dissemination of surface uality parameters (as COD, BOD, pH, DO, Turbidity, EC, TDS, TSS and Chloride), interpolating and many others. Fresh water is only just 0.3 to 0.5% able on the earth. and many others. Fresh water is only just 0.3 to 0.5% of the total water available on the earth. Water quality assessment is the inclusive process of physical, chemical and biological assessment of water in relative to natural quality, human exposure and targeted use, especially for use that may affect the health and well-being of human health. Water quality assessments include the use of monitoring to determine the status of water, providing a basis for detecting trends and providing information on causal links. Important aspects of the assessment are the interpretation and reporting of the results of the monitoring and the preparation of recommendations for future actions. GIS software has been commonly used in studies and water quality that helps any managerial decision making whose environmental impaction are directly or indirectly related to surface water. The Geographic Information System (GIS) is defined as an information system that is used to input, store, extract, manipulate, analyze and retrieve geographic data or geospatial data to support decision making on land use planning and management, transport, urban facilities, health services, etc. Water quality assessment is the inclusive process of physical, chemical and biological assessment of water in relative to natural quality, human exposure and targeted use, especially for use that may affect the human health. Water quality assessments include the use of monitoring to determine the status of water, providing a basis for detecting trends and providing information on causal links. Important aspects of the assessment are the ing of the results of the monitoring and the preparation of recommendations GIS software has been commonly used in studies and water quality that helps any managerial decision making whose environmental impaction are directly or indirectly related to surface water. The Geographic Information System (GIS) is defined as an on system that is used to input, store, extract, manipulate, analyze and retrieve geographic data or geospatial data to support decision making on land use planning and management, transport, urban facilities, health services, etc. Water pollution; GIS; physicochemical environment, environment, Water is the most valuable gift to mankind. Wat the soul of nature. Water is the energetic source that is used for different practices such as drinking, industrial cooling, energy production, irrigation, fish production cooling, energy production, irrigation, fish production Water is the most valuable gift to mankind. Water is the soul of nature. Water is the energetic source that is practices such as drinking, industrial @ IJTSRD | Available Online @ www.ijtsrd.com @ IJTSRD | Available Online @ www.ijtsrd.com | Volume – 2 | Issue – 2 | Jan-Feb 2018 Feb 2018 Page: 1437
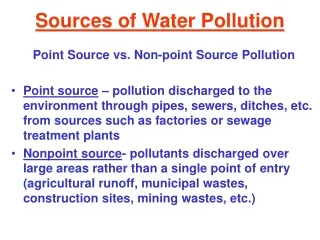
International Journal of Trend in Scientific Research and Development (IJTSRD) ISSN: 2456-6470 Javier Ferrer (2012) [03] assessed water quality and quantity in Jucar River Basin using two different models - one stationary (Geo-Impress) and another non-stationary (patriarch).Only two parameters are analysed which are BOD5 and TP. Impact of climate change on the river basin was observed using Patrical model. Two water bodies as surface water (SW) and groundwater (GW) were analysed. Generally, Geo- Impress model is used for SW and Patrical model is used for GW bodies. Comparison was done as compare previous year data with the current year data. Results show that the Nitrate pollution is the major problem in the study region. SehnazSener (2017) [04] evaluates water quality of Aksu River. Site selection was done by using GPS (Geo-positioning system). Water samples are taken from 21 locations for analysis from the study area. Water quality monitoring was performed during wet and dry period as Dry October – 2011 and wet May – 2012. pH, HCO3, Cl, SO4, Na, Ca, Mg, COD, NO3, NO2, Pb, Cr and Mn were taken into account for calculation of the WQI values. Drinking water quality is assessed by the Water Quality Index (WQI) method. The calculated WQI values are between 35.6133 and 337.5198 in the study. A water quality index (WQI) was calculated and the WQI results shown in the form of map by using GIS. At all the sampling points, COD value is over the limit as per WHO. The large range of variation in pH, temperature and EC values of the water samples is notable. The main reason may be large differences in altitude because the Aksu river basin covers a large area from south to north. Dilip Kumar Jah (2015) [05] took samples of seawater at 54 stations in 2011-2012 from Chidiyatappu, Port Blair, Rangat and Aerial Bay of Andaman Sea to assess the quality of seawater. Mapping technology based on CWQI (costal water quality index) and GIS is used to produce reliable, simple, and useful output to differentiate between healthy and polluted water quality monitoring areas in the coastal environment. Parameters which are analysed are as pH, DO, TP, BOD, TSS, nitrate, Ammonia, chlorophyll–a (chl–a), fecalcoliform (FC). WQI was calculated for all parameters and then overall WQI was evaluated for the study area. Quality parameters for sea water were interpolated using Inverse distance weighting (IDW) interpolation method. All individual water quality parameters showed a higher ranking on the open sea and lower in II. Literature Review A.General Various assessment of water contamination for water bodies have been discussed at research level from which referred many papers for study. These papers are presented as below. methodical research publications on B.Review of Literature Atefeh Mir, 2017[01] conducted spatial monitoring of chemical parameters of Sistan River water in the dry and wet years in order to obtain the actual variations in the water chemical quality, determine the most suitable sites to extract potable water and irrigation, and optimize management of water resource in Sistan plain. Analysis of TDS, SAR, EC, Na, Cl, Ca, SO4 and HCO3 was done. Mapping of the parameters was done in GIS using Geostatical method. Sistan River is selected as study area which is situated in Sistan- Baluchistan in the south eastern part of Iran, bordering Afghanistan. Inverse distance weighting (IDW) and Ordinary Kriging (OK) interpolation methods were used to get the spatial variations of quality of water sources used. Overlapping of map of each parameter is done and final map was generated by ArcGIS 10 Software. The result indicated that river’s water located in the range of good to average, good to unsuitable, acceptable to quite unpleasant, and good to quite unpleasant in terms of calcium and magnesium, chloride and sulphate, sodium and bicarbonate, and TDS. Ahmed EI-Zeiny (2016) [02] assessed water pollution using Landsat data and GIS at Burullus Lake, Egypt. Remote Sensing and GIS technology were used to detect the highly polluted area at Burullus Lake. Mainly 3 parameters are analysed which are BOD, TP and TN. Cartographic map of each parameters were created in ArcMap. Land use/Land cover (LULC) was produced for the study area. It was carried out to define natural resources and human activities dominating the land the surrounding area which might have an impact on Lake Water quality. For the analysis of Lake Water characteristics, 18 samples are collected within the lake region. The result indicated that south western and north eastern part of the lake are the most polluted parts, in the form of BOD, TN, TP. Burullus Lake is widely disturbed by human activities and has a great negative impact on water quality. @ IJTSRD | Available Online @ www.ijtsrd.com | Volume – 2 | Issue – 2 | Jan-Feb 2018 Page: 1438
International Journal of Trend in Scientific Research and Development (IJTSRD) ISSN: 2456-6470 the vicinity of the coast, inhabiting and internal parts of the bay. Nektarios N. Kourgialas (2016) [06] prepared map for the Fertilizer Water Pollution Index (FWPI) for assessing the impact of agricultural fertilizers on drinking and irrigation water quality. Groundwater samples collected from 235 different bore wells (10 drinking water wells and 225 irrigation wells) at Greece were analysed to determine the potential concentration in major and trace elements originated from fertilizers. The major pollutants were analysed as Fe+2, Mn+2, K+1, Zn+2, Cu+2, PO4-3, NO-3 and B+3 to assess the groundwater contaminated by fertilizers. The spatial analysis of groundwater contamination was performed in the form of map by interpolating the data from sampling points using Inverse Distance Weighting (IDW) method. Fertilizer Water Pollution Index (FWPI) map was generated using GIS. Results of this study shows that the Iron (Fe+2) and Potassium (K+1) concentration was high in the groundwater. Rima Chatterjee (2010) [07] studied overall water quality of the Dhanbad coal mining area in India. The main objective of the study is to assess groundwater quality using GIS based on available physico- chemical data from 79 locations in the Dhabad district. During the pre-monsoon months of April- May 2004, a total of 26 surface water, 41 subsurface water and 12 mine water samples were collected from 79 locations including urban, rural, industrial and mining areas. F-, Cl-, NO3-, SO42-, HCO3- and Ca2+ and Mg2+ were analysed by ion chromatograph. The total dissolved solids (TDS) ranging between 76-1.209 mg/l in the surface water, 144 and 1.412 mg/l in the subsurface water and 298- 1.498 mg/l in mine water samples. Ca2+ and Mg2+ contribute about 70-80% of the total hardness in surface, subsurface and mine water of Dhanbad district. Arcview 3.2a GIS contouring methods have been used to generate various thematic maps on TDS, hardness, pH, and ion concentration. The classification map shows that TDS, nitrate, chloride and fluoride are within the allowable range of Dhanbad, except for TD concentrations in the Sindh area. Bilgehan Nas (2010) [08] studied the quality of groundwater in Konya, a city in central Turkey. Groundwater quality was determined by sampling from 177 wells in the study area. Groundwater quality parameters were analysed such as EC, pH, SO4-2, NO3-, Cl- and hardness. ArcGIS 9.0 and ArcGIS Geostatistical Analyst were used for generation to produce the final groundwater quality map. Various thematic maps and ArcGIS Spatial Analyst were generated by using an interpolation technique, ordinary kriging to obtaine the spatial distribution of groundwater quality parameters. The results show that the southwestern city has optimum groundwater quality and the groundwater quality decreases south to north of the city. Weiwu Yan (2016) [09] evaluated the drinking water quality in Shanghai city at China by using a weighted aggregative index, a method for evaluating the problems with multiple indexes. 215 monitoring sites were selected for comprehensive assessment and monitoring of the drinking water quality. The quality of drinking water in the study area was evaluated and analyzed by seven qualitative and quantitative parameters such as color, consumption, manganese residual chlorine, total number of coliforms and total number of bacteria. Drinking water quality was displayed in the form of map which was generated by GIS. Judgement matrix was constructed by AHP (Analytic hierarchy procedure). Spatial distribution of drinking water quality was generated using Kriging interpolation method. Fernando Manardi (2014) [10] represents the development of a GIS-based water quality model that represents the impact of point source pollutants released at distinct durations under different flow scenarios. The study was conducted in the Paraiba do Sul river basin in south-eastern Brazil. The model is called SIAQUA-IPH and uses a pollution convolution scheme to represent multiple discharges. Seven sampling points were selected for analysis of water pollution in the study area. JacekAndrzej (2016) [11] created a tool that supports the assessment of regional Lake Quality using Landsat 8 imagery data. Lake water quality classification was done with the water framework directives (WFD). The study area covers northern Poland, where there are many densely distributed clusters of postglacial lake. The study was conducted on June 5 and July 7, 2014. The parameters which measured for the study were as colour, dissolved organic matter (CDOM), dissolved organic carbon (DOC), Secchi depth (SD), chlorophyll-a (Chl-a) and suspended particulate matter (SPM). Fang Lu (2014) [12] developed a water quality turbidity, oxygen @ IJTSRD | Available Online @ www.ijtsrd.com | Volume – 2 | Issue – 2 | Jan-Feb 2018 Page: 1439
International Journal of Trend in Scientific Research and Development (IJTSRD) ISSN: 2456-6470 assessment system (MWQ-FES) around the offshore oil platform based on GIS. A GIS-based GUI (Graphical User Interface) system displays results in the form of contour maps and color-coded maps, indicating the level of risk. The risk profile generated by MWQ-FES reflects the spatial distribution of integrated water quality index value, eutrophication risk levels and heavy metal risk indices in the study area. COD, DO, inorganic nitrogen, oil, Cd, Cr, Hg, Cu, As and Zn were analysed to check the quality of water. The results showed that the overall water quality of the study area was good in October 2005, May 2006 and September 2007, and the fair water quality in May 2007. Joseph H. Hoover (2014) [13] created an Internet geographic information groundwater pollution in the Navajo region of the southwestern United States. In Navajo, arsenic is one of the most common groundwater pollutants, so they analyzed arsenic contamination in groundwater. In this article, the Internet GIS was created to illustrate the arsenic contamination and safe passage of drinking water throughout the Navajo Nation. Map of arsenic contamination in groundwater was generated by using Internet GIS to visualize water quality information and access to water hauling station. Alexander H. Elliott (2016) [14] presented CLUES (Catchment Land Use Sustainability) model to address requirement of modelling tools for rapid evaluation of land use and management scenarios for management of freshwater quality. Parameters which are analysed for this study were TN, TP, sediments and E-coli throughout New Zealand. In this study, CLUSE was used for estimation of potential nutrient concentration for estuaries and provide key farm socio-economic indicators. III. Conclusion References 1.Ahmed EI-Zeiny, S. E.-K., “Assessment of water pollution induced by human activities in Burullus Lake using landsat 8 operational land imager and GIS”, The Egyptian journal of remote sensing and space science, 2016, S49-S56. 2.Alexander H. Elliott, A. F.-D.,“A national GIS- based system for modelling impacts of land use on water quality”, Environmental modelling and software, 2016, 131-144. 3.Atefeh Mir, J. P.,“Spatial monitoring and zoning water quality of Sistan River in the wet and dry years using GIS and geostatistics”, 2017, Computers and Electronics in Agriculture, 38-50. system to visualize 4.Bilgehan Nas, A. B., “Groundwater Quality Mapping in Urban Groundwater Using GIS”, Environmental Monitoring and assessment, 2009. 5.Dilip Kumar Jha, M. P., “Water quality assessment using water quality index and geographical information system methods in the coastal waters of Andaman Sea, India”, Marine pollution bulletin, 2015. 6.Fang Lu, Z. C.,“A Gis-based system for assessing marine water quality around offshore platforms”, Ocean and coastal management, 2014, 294-306. and Environmental 7.Fernando Mainardi Fan, A. S., “Large-scale analytical water quality model coupled with GIS for simulation of point sourced pollutant discharges”, Environmental Software, 2015, 58-71. Modelling and 8.Jacek Andrzej Urbanski, A. W., “ Application of Landsat 8 imagery to regionalscale assessment of lake water quality”, International journal of applied earth observation and geoinformation, 2016, 28-36. 9.Javier Ferrer, M. A.-M., “GIS-based models for water quantity and quality assessment in the Jucar River Basin, Spain, including climate change effects”, Science of the Total Environment, 2012, 42-59. From the above literature, we have concluded that due to increase in urbanisation and industrialization water pollution of surface water bodies increases day by day and hence there is a need of proper analysis of water and prior treatment. Geo-informatics play vital role in mapping, monitoring, planning, management and development of Surface water resources in an area. There is urgent need to use geo-informatics in water resources planning and management. 10.Joseph H. Hoover, P. C., “Designing and evaluating a groundwater quality internet GIS”, Applied geography, 2014, 55-65. 11.Nektarios N. Kourgialas, G. P., “A GIS policy approach for assessing the effect of fertilizers on the quality of drinking and irrigation water and wellhead protection zones (Crete, Greece)”, @ IJTSRD | Available Online @ www.ijtsrd.com | Volume – 2 | Issue – 2 | Jan-Feb 2018 Page: 1440
International Journal of Trend in Scientific Research and Development (IJTSRD) ISSN: 2456-6470 Journal of environmental management, 2016, 150- 159. 12.Rima Chatterjee, G. T., “Groundwater quality assessment of Dhanbad district, Jharkhand, India”, Bull Eng Geol Environ , 2010, 137-141. 13.Sehnaz Sener, E. S.,“Evaluation of water quality using water quality index (WQI) method and GIS in Aksu River”, Science of the total environment, 2017, 131-144. 14.Weiwu Yan, J. L.,“Comprehensive Assessment and Visualized Monitoring of Urban Drinking Water Quality”, 2016. @ IJTSRD | Available Online @ www.ijtsrd.com | Volume – 2 | Issue – 2 | Jan-Feb 2018 Page: 1441