Download

1 / 10
100 likes | 120 Views
The present study has been conducted to assess the spatial variations in rainfall in Hunsur taluk, Karnataka, India. In order to discuss spatial and temporal variations in rainfall, 5 rain gauge stations have been chosen to collect data for the years 1985 to 2005. Data have been collected mainly from the District Statistical Office, Mysore. These collected data have been used to examine year wise spatial variations of rainfall using ArcGIS. Co efficient of variation has also been computed to assess the area where average rainfall can be expected, in the future. The result shows that, the study area has fluctuations in rainfall and Hyrige raingage station received maximum annual rain, Hunsur tobacco research center received minimum annual rain and Undavadi received lowest annual rain fall. Gangadhara G "Spatio-Temopral Rain Fall Variation ; A Case Study of Western Part of Hunsur Taluk, Mysore District, Karnataka, India" Published in International Journal of Trend in Scientific Research and Development (ijtsrd), ISSN: 2456-6470, Volume-1 | Issue-6 , October 2017, URL: https://www.ijtsrd.com/papers/ijtsrd5775.pdf Paper URL: http://www.ijtsrd.com/humanities-and-the-arts/geography/5775/spatio-temopral-rain-fall-variation--a-case-study-of-western-part-of-hunsur-taluk-mysore-district-karnataka-india/gangadhara-g<br>

E N D
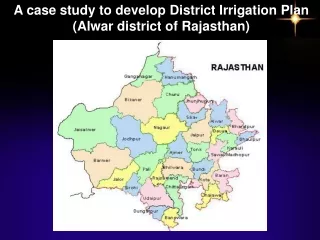
International Research Research and Development (IJTSRD) International Open Access Journal Temopral Rain Fall Variation ; A Case Study of Western Part of Hunsur Taluk, Mysore District, Karnataka, India of Hunsur Taluk, Mysore District, Karnataka, India International Journal of Trend in Scientific Scientific (IJTSRD) International Open Access Journal ISSN No: 2456 ISSN No: 2456 - 6470 | www.ijtsrd.com | Volume www.ijtsrd.com | Volume - 1 | Issue – 6 Spatio-Temopral Rain Fall of Hunsur Taluk, Mysore District, Karnataka, India Variation ; A Case Study of Western Part Gangadhara G Research scholar Department of studies in geography Manasagangotri, University of Mysore Manasagangotri, University of Mysore Dr. Subash. S. Sannasiddannanavr Associate Professor Department of studies in geography Manasagangotri, University of Mysore Manasagangotri, University of Mysore Sannasiddannanavr Associate Professor Department of studies in geography Department of studies in geography inhabitants are occupied in agricultural activities. The study of rainfall distribution pattern and its temporal variations is very important, as the country’s economy and agriculture it helps to explaining the various socio-economic problems The amount of rainfall does not show an equal distribution, either in space or in time. It varies from heavy rain to scanty in different parts. It also has great regional and temporal variations in distribution. Therefore, the study has been conducted in order to help farmers to take necessary steps for cultivation process and policy makers plan developer making well developmental plans. ABSTRACT inhabitants are occupied in agricultural activities. The study of rainfall distribution pattern and its temporal is very important, as the country’s economy and agriculture it helps to explaining the various economic problems The amount of rainfall does not show an equal distribution, either in space or in time. It varies from heavy rain to scanty in different parts. It also has great regional and temporal variations in distribution. Therefore, the study has been conducted in order to help farmers to take necessary steps for cultivation process and policy makers plan developer making well developmental The present study has been conducted to assess the spatial variations in rainfall in Hunsur talu Karnataka, India. In order to discuss spatial and temporal variations in rainfall, 5 rain gauge stations have been chosen to collect data for the years 1985 to 2005. Data have been collected mainly from the District Statistical Office, Mysore. These coll data have been used to examine year variations of rainfall using Inverse Distance Weighted (IDW) method in ArcGIS. Co-efficient of variation has also been computed to assess the area where average rainfall can be expected, in the future. result shows that, the study area has fluctuations in rainfall and Hyrige raingage station received maximum annual rain, Hunsur tobacco research center received minimum annual rain and Undavadi received lowest annual rain fall. Keywords: IDW, Interpolation technique polation technique The present study has been conducted to assess the spatial variations in rainfall in Hunsur taluk, Karnataka, India. In order to discuss spatial and temporal variations in rainfall, 5 rain gauge stations have been chosen to collect data for the years 1985 to 2005. Data have been collected mainly from the District Statistical Office, Mysore. These collected data have been used to examine year-wise spatial variations of rainfall using Inverse Distance Weighted efficient of variation has also been computed to assess the area where average rainfall can be expected, in the future. The result shows that, the study area has fluctuations in rainfall and Hyrige raingage station received maximum annual rain, Hunsur tobacco research center received minimum annual rain and Undavadi PURPOSE OF STUDY The purpose of the study is to discuss the rainfall variability in Hunsur taluk Karnataka, India. The rainfall data have been collected from 5 rainfall gauge stations in the taluk which could be analyzed and interpreted. STUDY AREA: KARNATAKA INDIA. Western part of Hunsur Taluk lies between latitudes 12° 15′to 12° 25′ N and longitudes 76° 5 (Survey of India topographic sheets 57D/3, 57D/4, 57D/7and 57D/8) covering an area 633.77 Km2. The taluk is bound on the north by Mysore and part of k r nagar taluk and on the east by H D kote. piriyapattana forms its western boundary and the southern portion is forms its western boundary and the southern portion is The purpose of the study is to discuss the rainfall variability in Hunsur taluk Karnataka, India. The rainfall data have been collected from 5 rainfall gauge stations in the taluk which could be analyzed and INTRODUCTION Hydrometeorology is defined as the study of atmospheric processes that affect the water resources of earth. A broader definition of the term was given by the World Meteorological Organization; that is concerned with the study of atmospheric and land phases of the hydrologic cycle with the emphasis on the interrelationships involved (Reddi, 19996). Hydrometeorology is also defined as the study of the movement of water and vapour in the atmosphere (Raghunath, 1990). Rainfall is an important element of economic growth of an area or region, especially in a country like India, where a huge quantity of a country like India, where a huge quantity of Hydrometeorology is defined as the study of atmospheric processes that affect the water resources of earth. A broader definition of the term was given by the World Meteorological Organization; that is study of atmospheric and land phases of the hydrologic cycle with the emphasis on the interrelationships involved (Reddi, 19996). Hydrometeorology is also defined as the study of the movement of water and vapour in the atmosphere HUNSUR HUNSUR TALUK, TALUK, Western part of Hunsur Taluk lies between latitudes N and longitudes 76° 5′ to 76° 25′ E (Survey of India topographic sheets 57D/3, 57D/4, 57D/7and 57D/8) covering an area 633.77 Km2. The the north by Mysore and part of k r nagar taluk and on the east by H D kote. piriyapattana l is an important element of economic growth of an area or region, especially in @ IJTSRD | Available Online @ www.ijtsrd.com @ IJTSRD | Available Online @ www.ijtsrd.com | Volume – 1 | Issue – 6 | Sep - Oct 2017 Oct 2017 Page: 1182
International Journal of Trend in Scientific Research and Development (IJTSRD) ISSN: 2456-6470 covered by kodagu district. The study area belongs to one out of seven taluks of Mysore district. Hunsur town, headquarter of Hunsur taluk, is located about 35 km NW of Mysore city. Most of the places in the study area are well connected by roads. Some of the major roads that run through the study area include National Highway No. 88, passing through the western and eastern part of the study area, using this National high the area can be easily approached from GIS calculates the area based on the plain surface so that this area may change when compared with topographical area of Western part of Hunsur Taluk . The climate of the district is moderate throughout the year, and the district gets rainfall during two seasons, namely, the southwest monsoon season or rainy season, which is between June to September and retreating monsoon season during October and November. @ IJTSRD | Available Online @ www.ijtsrd.com | Volume – 1 | Issue – 6 | Sep - Oct 2017 Page: 1183
International Journal of Trend in Scientific Research and Development (IJTSRD) ISSN: 2456 Scientific Research and Development (IJTSRD) ISSN: 2456 Scientific Research and Development (IJTSRD) ISSN: 2456-6470 several methods and among them the IDW has been a popular method. The results of the IDW are highly acceptable to the scientific community. Therefore, the study has used the IDW technique to measure the spatial variations in rainfall in the district using the rainfall data from the five rain gauge stations. Spatial Variations: The analysis of year variations in rainfall shows that the study area has annual as well as seasonal fluctuations in rainfall, every year, The temporal classification of year wise rainfall distribution shows that during the year of 1988.1998.1999 2005 huge area have been covered by high and very high rainfall, while rainfall of the study area for the period 1985 930 mm. Annual rainfall in the study area during was very low and fell under severe drought condition. South‐West monsoon and North‐East monsoon, contribute 90% of the annual rainfall. By using Inverse Distance Weighted (IDW) method, spatial distribution of rainfall for 5 rainfall gauge stations was carried out. The results indicated that south‐western part of the study area receives higher precipitation compare to the north is mainly due to its hilly and forest area. determination of the effect of climatic change on rainfall distribution and its trend, Man seasonal test is performed and the results revealed no significance trend. By using smoothing technique, the scatter plot (mean precipitation of 3 seasons) revealed temporary upward and downward trend of rainfall (1985‐2005). It is noticed that there is slight decrease in the amount of precipitation during the 21 years. in the amount of precipitation during the 21 years. ‐2005) ods and among them the IDW has been a popular method. The results of the IDW are highly acceptable to the scientific community. Therefore, the study has used the IDW technique to measure the spatial variations in rainfall in the district using the data from the five rain gauge stations. Spatial Variations: The analysis of year-wise spatial variations in rainfall shows that the study area has annual as well as seasonal fluctuations in rainfall, every year, The temporal classification of year wise ainfall distribution shows that during the year of 1988.1998.1999 2005 huge area have been covered by high and very high rainfall, while The average rainfall of the study area for the period 1985‐2005 is 930 mm. Annual rainfall in the study area during 2002 was very low and fell under severe drought condition. ‐West monsoon and North‐East monsoon, contribute 90% of the annual rainfall. By using Inverse Distance Weighted (IDW) method, spatial distribution of rainfall for 5 rainfall gauge stations carried out. The results indicated that ‐western part of the study area receives higher precipitation compare to the north‐eastern part which is mainly due to its hilly and forest area. For determination of the effect of climatic change on distribution and its trend, Man‐Kendal and seasonal test is performed and the results revealed no significance trend. By using smoothing technique, the scatter plot (mean precipitation of 3 seasons) revealed temporary upward and downward trend of rainfall ‐2005). It is noticed that there is slight decrease RESEARCH METHODOLOGY. the present study were collected from Tobacco research centre, Hunsur, Central Groundwater Board; Mysore and the Indian Statistical Department, Mysore. The researchers have been using various method of interpolation (David et al., 2004) to measure continues surface value from the data. There are several studies which have been conducted using IDW method to assess the rainfall distribution (Feng Wen Chen, 2012), this study followed IDW method to examine year wise spatial variation of rainfall using Inverse Distance Weighted (IDW) method in ArcGIS. The co-efficient of variation is one of the popular method (Mishra, 1991) which used to measure the variation in the values, so this study also used co efficient of variation to find out the temporal variation in the rainfall and the result of the analysis has been mapped to find out the spatial variations of co efficient values. RESULT AND DISCUSSION: VARIATIONS IN RAIN FALL. There are five rain gauge stations located in different places in western part of Hunsur, and these stations measure the precipitation throughout the year, the spatial location and name of the rain gauge stations are shown in Figure1. The rain gauge stations measure rainfall only in their locations, and so it is necessary to adopt some mathematic model to calibrate rainfall for the entire region. There are Monthly Rainfall (Mm) Monthly Rainfall (Mm) of the Study Area (Years 1985‐2005) the present study were collected from Tobacco research centre, Hunsur, Central Groundwater Board; Mysore and the Indian Statistical Department, hers have been using various method of interpolation (David et al., 2004) to measure continues surface value from the data. There are several studies which have been conducted using IDW method to assess the rainfall distribution (Feng- study followed IDW method to examine year wise spatial variation of rainfall using Inverse Distance Weighted (IDW) method in ArcGIS. efficient of variation is one of the popular method (Mishra, 1991) which used to measure the s, so this study also used co- efficient of variation to find out the temporal variation in the rainfall and the result of the analysis has been mapped to find out the spatial variations of co- RESULT AND DISCUSSION: SPATIAL SPATIAL There are five rain gauge stations located in different places in western part of Hunsur, and these stations measure the precipitation throughout the year, the l location and name of the rain gauge stations are shown in Figure1. The rain gauge stations measure rainfall only in their locations, and so it is necessary to adopt some mathematic model to calibrate rainfall for the entire region. There are @ IJTSRD | Available Online @ www.ijtsrd.com @ IJTSRD | Available Online @ www.ijtsrd.com | Volume – 1 | Issue – 6 | Sep - Oct 2017 Oct 2017 Page: 1184
International Journal of Trend in Scientific Research and Development (IJTSRD) ISSN: 2456-6470 Station Wise Monthly Average Rainfall (MM) of the Study Area (Years 1985‐ ‐2005) @ IJTSRD | Available Online @ www.ijtsrd.com | Volume – 1 | Issue – 6 | Sep - Oct 2017 Page: 1185
International Journal of Trend in Scientific Research and Development (IJTSRD) ISSN: 2456-6470 Station Wise Seasonal and Annual Rainfall (MM) of the Study Area (Years 1985‐ ‐2005) @ IJTSRD | Available Online @ www.ijtsrd.com | Volume – 1 | Issue – 6 | Sep - Oct 2017 Page: 1186
International Journal of Trend in Scientific Research and Development (IJTSRD) ISSN: 2456-6470 Analysis of Average Pre‐ ‐Monsoon Rainfall (MM) of the Study Area Using IDW Method @ IJTSRD | Available Online @ www.ijtsrd.com | Volume – 1 | Issue – 6 | Sep - Oct 2017 Page: 1187
International Journal of Trend in Scientific Research and Development (IJTSRD) ISSN: 2456-6470 Analysis of South‐ ‐West Monsoon Rainfall (MM) of the Study Area Using IDW Method @ IJTSRD | Available Online @ www.ijtsrd.com | Volume – 1 | Issue – 6 | Sep - Oct 2017 Page: 1188
International Journal of Trend in Scientific Research and Development (IJTSRD) ISSN: 2456-6470 Analysis of North‐ ‐East Monsoon Rainfall (MM) of the Study Area Using IDW Method @ IJTSRD | Available Online @ www.ijtsrd.com | Volume – 1 | Issue – 6 | Sep - Oct 2017 Page: 1189
International Journal of Trend in Scientific Research and Development (IJTSRD) ISSN: 2456 Scientific Research and Development (IJTSRD) ISSN: 2456 Scientific Research and Development (IJTSRD) ISSN: 2456-6470 [7] Mohapatra, Mohanty (2006): Spatio-temporal variability of summer monsoon rainfall over Orissa in relation to low pressure systems, J. Earth Syst. Sci. [7] Mohapatra, Mohanty (2006): Spatio variability of summer monsoon rainfall over Orissa in relation to low pressure systems, J. Earth Syst. Sci. 115, No. 2, pp. 203–218. CONCLUTION. The spatial variations of year-wise rainfall show that the study area has fluctuations in rainfall both in space and time in all areas of the rain gauge stations. maximum rainfall is received (955.22 mm) in Hyrige gauge station. where as the minimum of 922.54 mm is received in Undavadi station. In the study the annual average rainfall varies from 909.55 to 955.22 mm .The spatial distribution of annual rainfall by IDW method. The result of this study can help the people, those who depend on rainfall, especially the farmers to take necessary steps in their cultivation of crops in the coming years. REFERENCE. [1] Edmore, Kori (2012): The influence of rainfall variability on Arable land use at local level: realities from Nzhelele Valley, South Africa, International Conference on Future Environment and Energy, IPCBEE vol.28, IACSIT Press, Singapoore, pp:218 223 wise rainfall show that the study area has fluctuations in rainfall both in space time in all areas of the rain gauge stations. The maximum rainfall is received (955.22 mm) in Hyrige gauge station. where as the minimum of 922.54 mm is received in Undavadi station. In the study the annual average rainfall varies from 909.55 to 955.22 mm .The spatial distribution of annual rainfall by IDW . The result of this study can help the people, those who depend on rainfall, especially the farmers to take necessary steps in their cultivation of crops in [8] Odekunle, Orinmoogunje, Ayanlade (2007): Application of GIS to assess rainfall variability in Guinean Savanna part of Nigeria, African Journal of Biotechnology Vol. 6 [8] Odekunle, Orinmoogunje, Ayanlade (2007): Application of GIS to assess rainfall variability impacts on crop yield in Guinean Savanna part of Nigeria, African Journal of Biotechnology Vol. 6 (18), pp: 2100-2113. [9] Rathod , Aruchamy (2010): Spatial Analysis of Rainfall Variation in Coimbatore District Tamilnadu using GIS, INTERNATIONAL JOURNAL OF GEOMATICS AND GEOSCIENCES Volume 1, No [9] Rathod , Aruchamy (2010): Spatial Analysis of Rainfall Variation in Coimbatore District using GIS, INTERNATIONAL JOURNAL OF GEOMATICS AND GEOSC 2, pp: 106 – 118. [10] Jayawardene, Sonnadara, Jayewardene (2005): Trends of Rainfall in Sri Lanka over the Last Century, Sri Lankan Journal of Physics, Vol. 6, pp: 7 Sri Lankan Journal of Physics, Vol. 6, pp: 7-17 [10] Jayawardene, Sonnadara, Jayewardene (2005): Trends of Rainfall in Sri Lanka over the Last Century, [11] Xuesong Zhang, Raghavan Srinivasan (2010): precipitation estimation using next generation radar and raingauge data, Environmental [11] Xuesong Zhang, Raghavan Srinivasan (2010): GIS-based spatial precipitation estimation using next generation radar and raingauge data, Environmental Modelling & Software xxx, pp: 1 Modelling & Software xxx, pp: 1-8. [1] Edmore, Kori (2012): The influence of rainfall variability on Arable land use at local level: realities from Nzhelele Valley, South Africa, International Conference on Future Environment and Energy, IPCBEE vol.28, IACSIT Press, Singapoore, pp:218 – [12] Latha, Rajendran, and Vasudevan (2014): Spatial analysis of rainfall using GIS in Veeranam catchment, [12] Latha, Rajendran, and Vasudevan (2014): Spatial analysis of rainfall using GIS in Veeranam catchment, Cuddalore district, Tamil Nadu, India, International Journal of Recent Scientific Research, Vol. 5, Issue, 1, pp:36-39. Nadu, India, International [2] Jegankumar, Nagarathinam and Kannadasan (2012): Spatial distribution of rainfall in Salem and Namakkal districts, INTERNATIONAL JOURNAL OF GEOMATICS AND GEOSCIENCES, Volume 2, No 4, 2012 pp: 976 – 994 [2] Jegankumar, Nagarathinam and Kannadasan (2012): Spatial distribution of rainfall in Salem and Namakkal districts, INTERNATIONAL JOURNAL OF GEOMATICS AND GEOSCIENCES, Volume 2, Journal of Recent Scientific Research, Vol. 5, Issue, [13] Vekateswaran, Vijay Prabhu, Suresh and [13] Vekateswaran, Vijay Prabhu, Suresh and Palanisamy (2012): Assessment of rainfall Palanisamy (2012): Assessment of rainfall [3] NeerajBhargava, RituBhargava, Prakash Singh Tanwar, Ankit Sharma (2013): Rainfall Spatial Analysis using GIS, International Journal of Advanced Research in Computer and Communication Engineering Vol. 2, Issue 5, May 2013, pp: 2197 2200 [3] NeerajBhargava, RituBhargava, Prakash Singh anwar, Ankit Sharma (2013): Rainfall Spatial Analysis using GIS, International Journal of Advanced Research in Computer and Communication Engineering Vol. 2, Issue 5, May 2013, pp: 2197 – variability in GIS environment at Sarabanga subbasin ia, International Journal of Geology, Earth and Environmental Sciences, Vol. 2, variability in GIS environment at Sarabanga subbasin Cauvery river South India, International Journal of Geology, Earth and Environmental Sciences, Vol. 2, pp:18-24 [14] Boye, Yakubu and Pokperlaar (2011): Spatio- Temporal Variability of Rainfall Distribution in the Western Region of Ghana, Research Journal of [14] Boye, Yakubu and Pokperlaar (2011): Spatio Temporal Variability of Rainfall Distribution in the Western Region of Ghana, Research Journal of Environmental and Earth Sciences 3(4), pp: 393 rth Sciences 3(4), pp: 393- 399 [4] Khan,Asim (2000): A Spatio – Temporal Analysis of rainfall in the canal command areas of the Indus plains, International Water management Institute, Report No: R-104 pp: 1- 35 Temporal Analysis of rainfall in the canal command areas of the Indus plains, International Water management Institute, [15] Tirkey Anamika Shalini, Pandey and Nathawat [15] Tirkey Anamika Shalini, Pandey and Nathawat (2012): Groundwater Level and Rainfall (2012): Groundwater Level and Rainfall [5] Kusre, B. C. (2012): Study of spatial and temporal distribution of rainfall INTERNATIONAL JOURNAL OF GEOMATICS AND GEOSCIENCES,Volume 2, No 3, 2012, pp: 712 – 722 [5] Kusre, B. C. (2012): Study of spatial and temporal distribution of rainfall NATIONAL JOURNAL OF GEOMATICS AND GEOSCIENCES,Volume 2, No 3, 2012, pp: Variability Trend Analysis using GIS in parts of Jharkhand state (India) for Sustainable of Water Resources, International Re Environment Sciences, Vol. 1(4), pp: 24 Environment Sciences, Vol. 1(4), pp: 24-31 Variability Trend Analysis using GIS in parts of Jharkhand state (India) for Sustainable Management of Water Resources, International Research Journal of in in Nagaland Nagaland (India), (India), [16] Hazbavi and Sadeghi (2013): Analysis of Spatial Trend of Rainfall Erosivity in Iran, 1st Trend of Rainfall Erosivity in Iran, 1st [16] Hazbavi and Sadeghi (2013): Analysis of Spatial [6] Margaret R (1996) spatial modeling and interpolation of monthly temperature using kriging, CLIMATE RESEARCH, Vol. 6, pp: 215 CLIMATE RESEARCH, Vol. 6, pp: 215- 225 [6] Margaret R (1996) spatial modeling and interpolation of monthly temperature using kriging, International Conference on Environmental Crisis and International Conference on Environmental Crisis and Its Solutions, pp: 434 – 440. @ IJTSRD | Available Online @ www.ijtsrd.com @ IJTSRD | Available Online @ www.ijtsrd.com | Volume – 1 | Issue – 6 | Sep - Oct 2017 Oct 2017 Page: 1190
International Journal of Trend in Scientific Research and Development (IJTSRD) ISSN: 2456-6470 [17] Sadeghi, Moatamednia, and Behzadfar (2011): Spatial and Temporal Variations in the Rainfall Erosivity Factor in Iran, J. Agr. Sci. Tech. Vol. 13, pp: 451-464 [19] Yair Goldreich (1995): Temporal variations of rainfall in Israel, CLIMATE RESEARCH, Vol. 5, pp: 167-179 [20] Waleed, Rijabo, Hanee, Salih (2013): Spatial and Temporal Variation of Rainfall in IRAQ, IOSR Journal of Applied Physics, Vol 5, Issue 4, pp: 01- 07 [18] Zengxin Zhang, Chong-Yu Xu, Majduline El-Haj El-Tahir, Jianrong Cao, V. P. Singh (2011): Spatial and temporal variation of precipitation in Sudan and their possible causes during 1948– 2005, Stoch Environ Res Risk Assess, Vol. 26,pp:429–441 [21] Tetsuzo YASUNARI, TelD.poral and Spatial Variations of Monthly Rainfall in Java, Indonesia, Southeast Asian Studies, Vol. 19, No.2, pp: 170 @ IJTSRD | Available Online @ www.ijtsrd.com | Volume – 1 | Issue – 6 | Sep - Oct 2017 Page: 1191