Download
1 / 10
100 likes | 126 Views
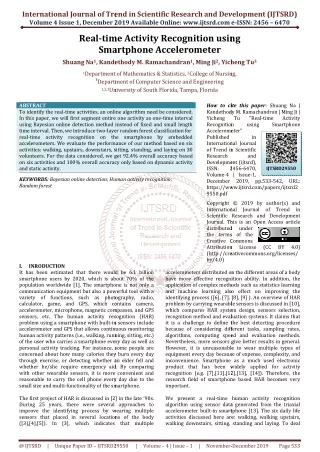
To identify the real time activities, an online algorithm need be considered. In this paper, we will first segment entire one activity as one time interval using Bayesian online detection method instead of fixed and small length time interval. Then, we introduce two layer random forest classification for real time activity recognition on the smartphone by embedded accelerometers. We evaluate the performance of our method based on six activities walking, upstairs, downstairs, sitting, standing, and laying on 30 volunteers. For the data considered, we get 92.4 overall accuracy based on six activities and 100 overall accuracy only based on dynamic activity and static activity. Shuang Na | Kandethody M. Ramachandran | Ming Ji | Yicheng Tu "Real-time Activity Recognition using Smartphone Accelerometer" Published in International Journal of Trend in Scientific Research and Development (ijtsrd), ISSN: 2456-6470, Volume-4 | Issue-1 , December 2019, URL: https://www.ijtsrd.com/papers/ijtsrd29550.pdf Paper URL: https://www.ijtsrd.com/mathemetics/other/29550/real-time-activity-recognition-using-smartphone-accelerometer/shuang-na<br>

E N D
International Journal of Trend in Scientific Research and Development (IJTSRD) Volume 4 Issue 1, December 2019 2019 Available Online: www.ijtsrd.com International Journal of Trend in Scientific Research and Development (IJTSRD) International Journal of Trend in Scientific Research and Development (IJTSRD) e-ISSN: 2456 – 6470 Real-time Activity Recognition using Smartphone Accelerometer Shuang Na1, Kandethody M. Ramachandran Kandethody M. Ramachandran1, Ming Ji2, Yicheng Tu time Activity Recognition using Smartphone Accelerometer time Activity Recognition using Yicheng Tu3 1Department 3Department 1,2,3University epartment of Mathematics & Statistics, 2College of Nursing epartment of Computer Science and Engineering niversity of South Florida, Tampa, Florida f Nursing, ABSTRACT To identify the real-time activities, an online algorithm In this paper, we will first segment entire one activity as one using Bayesian online detection method instead of fixed time interval. Then, we introduce two-layer random forest classification for real-time activity recognition on the smartphone by embedded accelerometers. We evaluate the performance of our method activities: walking, upstairs, downstairs, sitting, volunteers. For the data considered, we get 92.4% overall accuracy based on six activities and 100% overall accuracy only based on dynamic activity and static activity. KEYWORDS: Bayesian online detection; Human activity recognition; Random forest How to cite this paper Kandethody M. Ramachandran | Ming Ji | Yicheng Tu "Real Recognition using Accelerometer" Published in International Journal of Trend in Sc Research and Development (ijtsrd), ISSN: 2456 Volume-4 | Issue December 2019, https://www.ijtsrd.com/papers/ijtsrd2 9550.pdf Copyright © 2019 by author(s) and International Journal of Scientific Research and Development Journal. This is an Open Access article distributed under the terms of the Creative Commons Attribution License (http://creativecommons.org/licenses/ by/4.0) How to cite this paper: Shuang Na | Kandethody M. Ramachandran | Ming Ji | Yicheng Tu "Real-time Recognition using Accelerometer" Published in International Journal of Trend in Scientific Research and Development (ijtsrd), ISSN: 2456-6470, 4 | Issue-1, December 2019, https://www.ijtsrd.com/papers/ijtsrd2 time activities, an online algorithm need be considered. entire one activity as one-time interval detection method instead of fixed and small length layer random forest classification for time activity recognition on the smartphone by embedded accelerometers. We evaluate the performance of our method based on six downstairs, sitting, standing, and laying on 30 we get 92.4% overall accuracy based overall accuracy only based on dynamic activity Activity Smartphone Smartphone IJTSRD29550 ; Human activity recognition; pp.533 pp.533-542, URL: Copyright © 2019 by author(s) and International Journal of Trend in Scientific Research and Development Journal. This is an Open Access article distributed under the terms of the Creative Commons Attribution License http://creativecommons.org/licenses/ (CC (CC BY BY 4.0) 4.0) I. It has been estimated that there would be 6.1 billion smartphone users by 2020, which is about 70% of the population worldwide [1]. The smartphone is not only a communication equipment but also a powerful tool with a variety of functions, such as photography, radio, calculator, game, and GPS, which contains camera, accelerometer, microphone, magnetic compasses, and GPS sensors, etc. The human activity recognition (HAR) problem using a smartphone with built-in sensors include accelerometer and GPS that allows continuous monitoring human activity patterns (i.e., walking, running, sitting, etc.) of the user who carries a smartphone every day as well as personal activity tracking. For instance, some people are concerned about how many calories they burn through exercise, or detecting whether an elder fell and whether he/she require emergency aid. By comparing with other wearable sensors, it is more convenient and reasonable to carry the cell phone every day due to the small size and multi-functionality of the smartphone. The first project of HAR is discussed in [2] in the late ’90s. During 25 years, there were several approaches to improve the identifying process by wearing multiple sensors that placed in several locations of the body ([3],[4],[5]). In [3], which indicates that multiple [5]). In [3], which indicates that multiple INRODUCTION It has been estimated that there would be 6.1 billion smartphone users by 2020, which is about 70% of the population worldwide [1]. The smartphone is not only a communication equipment but also a powerful tool with a accelerometers distributed on the different areas of a body have more effective recognition ability. In addition, the application of complex methods such as statistics learning and machine learning also effect identifying process ([6], [7], [8], [9] ). An overview of HAR problem by carrying wearable sensors is discussed in [10], which compares HAR system design, sensors selection, recognition method and evaluation systems. It claims that it is a challenge to define the best detecting procedure because of considering different tasks, sampling rates, algorithms, computing speed and evaluation methods. Nevertheless, more sensors give better results in general. However, it is unreasonable to wear mul equipment every day because of expense, complexity, and inconvenience. Smartphone as a much used electronic product that has been widely applied for activity recognition (e.g. [7],[11],[12],[13], [14]). Therefore, the research field of smartphone based HAR becomes very important. We present a real-time human activity recognition algorithm using sensor data generated from the triaxial accelerometer built-in smartphone [13]. The six daily life activities discussed here are: walking, walking u walking downstairs, sitting, standing and laying. To deal walking downstairs, sitting, standing and laying. To deal accelerometers distributed on the different areas of a body have more effective recognition ability. In addition, the application of complex methods such as statistics learning and machine learning also effect on improving the identifying process ([6], [7], [8], [9] ). An overview of HAR problem by carrying wearable sensors is discussed in [10], which compares HAR system design, sensors selection, recognition method and evaluation systems. It claims that challenge to define the best detecting procedure because of considering different tasks, sampling rates, algorithms, computing speed and evaluation methods. Nevertheless, more sensors give better results in general. However, it is unreasonable to wear multiple types of equipment every day because of expense, complexity, and inconvenience. Smartphone as a much used electronic product that has been widely applied for activity recognition (e.g. [7],[11],[12],[13], [14]). Therefore, the phone based HAR becomes very hotography, radio, calculator, game, and GPS, which contains camera, accelerometer, microphone, magnetic compasses, and GPS sensors, etc. The human activity recognition (HAR) in sensors include at allows continuous monitoring human activity patterns (i.e., walking, running, sitting, etc.) of the user who carries a smartphone every day as well as personal activity tracking. For instance, some people are concerned about how many calories they burn every day through exercise, or detecting whether an elder fell and whether he/she require emergency aid. By comparing with other wearable sensors, it is more convenient and reasonable to carry the cell phone every day due to the onality of the smartphone. The first project of HAR is discussed in [2] in the late ’90s. During 25 years, there were several approaches to improve the identifying process by wearing multiple sensors that placed in several locations of the body time human activity recognition algorithm using sensor data generated from the triaxial in smartphone [13]. The six daily life activities discussed here are: walking, walking upstairs, @ IJTSRD | Unique Paper ID – IJTSRD29550 29550 | Volume – 4 | Issue – 1 | November- -December 2019 Page 533
International Journal of Trend in Scientific Research and Development (IJTSRD) @ www.ijtsrd.com eISSN: 2456-6470 with HAR problem, first of all, we must partition the entire time interval into segments because the raw data cannot be used in classification algorithm directly. Then, extract meaningful features (mean, standard deviation, peak, etc.) from every segment, which are applied to the classification algorithm, such as decision tree. Finally, we will train and test the identifying process. Because of limitation of cell phone’s battery and CPU, we cannot train the model on a cell phone. Usually, the training process is either already learned on a computer or happening on cloud computing through the Internet. However, technology is developing with time, more and more types of cell phones are allowed to run training algorithm on it [14]. Therefore, the user can collect data and identify activities on their phone; it is more convenient when a user wants to adapt the activity training model or when the Internet is not available. On the other hand, it is also desirable to develop more efficient and less complex learning models so that training procedure can be processed on the cell phone. For the classification method, there are two types of algorithm: online and offline learning ([15],[16]). By comparing with offline learning method, online learning can be applied to real-time training data because it is able to adapt the model as new data being collected. In this paper, we introduce a combination of Bayesian online detection algorithm and two-layer random forest classification, which can automatically identify human activities at a certain time without user intervening, such that user does not need to mark start time and end time for every activity. Using Bayesian online segmentation method to detect the time interval, we extract meaningful features based on a entire activity time interval that considered as a segment. These features from a entire activity contain more information than short time interval generated by fixed length time segmentation. For the training procedure, different classification layers use different features (section 2). The first layer aims to distinguish dynamic activities (walking, walking upstairs and walking downstairs) versus static activities (sitting, standing and lying). The main feature used in the first layer classifier is amplitude ix is dimension. During the second layer classification processing, there are two separated classification training models A and B to classify different sub-classes. If we get static activity on the first layer for a certain interval, then we go through model A at second layer to further classify as sitting, standing or lying; otherwise, we go through model B at second layer to further partition into walking, walking upstairs or walking downstairs. This paper is organized as follows. Section II presents the Bayesian online segmentation. Section III discusses two- layer classification method. In section IV, we present the result of applying the methods introduced to a real-time activity data. The conclusion is given in section V. II.METHODOLOGY For these developed human activity recognition (HAR) methods, the pre-processing procedure of HAR methods is to separate the whole time series interval into small segments. The reason for this step is important and necessary is that the raw individual observation cannot be applied directly in classification methods. In most of the literature, one partition the whole time series into equal length segments, the length of the segment could be 1.5s, 2s, and 3s, etc. However, these types of intervals are so short that cannot capture enough information of activities. In this paper, we complete this step based on Bayesian online segmentation method introduced in section 2.1. This method detects change points between two patterns, and it defines the time series between two change points as a segment. This procedure results in varying length of time intervals rather than equal length of time interval and small segments. Next step, we need to extract features from each segment. The feature widely used so far are categorized as time-domain features, frequency-domain features, wavelet features and Heuristic Features [17]. Here, we mainly use time-domain features and frequency- domain features. The review paper [10] discusses current classification methods that include decision tree, k-nearest neighbors, Bayesian, neural network, fuzzy logic, support vector machines, classifier ensembles, regression methods and Markov models that are applied widely in many publications and applications. In this work, we introduce two-layer random forest method for activity classification, we use accuracy and confusion matrix as the evaluation index. Fig 1 displays the process of real-time activity recognition. defined as + + + th 2 ,1 i 2 ,2 i 2 ,p i , point with p- i ... x x x A.Bayesian Online Segmentation In this paper, we consider the three-dimensional data ( , , ) t t t t x x x x = at time t with frequency 50Hz that is generated by smartphone accelerometer. The task of classifying the human patterns from these sensor data is to group homogeneous heterogeneous data sets. These observations are listed on timeline, all observations between two change points construct a time series segment defined as a pattern. Those homogeneous observations are assumed to follow a multi-normal distribution, and different patterns follow different multi-normal distributions. Therefore, to find the change point between two patterns becomes a significant problem. points 1 2 3 data sets and separate @ IJTSRD | Unique Paper ID – IJTSRD29550 | Volume – 4 | Issue – 1 | November-December 2019 Page 534
International Journal of Trend in Scientific Research and Development (IJTSRD) @ www.ijtsrd.com eISSN: 2456-6470 In [18] and [10], an overview of the human activity recognition process and discussion of segmenting methods. Bayesian online detection method [19] can be used to prepare these segments automatically for classification. First, we consider the concept of “run length” tr, which is the length of the current run at time t and it is linear about time t. For example, if rt = 0 t ( ) r tx ( ) 9 x 8x is a change point; if rt= 0, we keep run one more and repeat the process. x is an empty set. For example, t=9, ( ) t t P r x , we need to generate a recursive joint distribution P (rt, x1:t), ( , ) ) ( , ) ( ) t P x P r r x x − − ∝ ∑ ∑ ∑ at t=8, is defined as the set { , }. x x = To find the tr = r ( ) r 1, correspond to run length rt. If rtis zero, then 8 9 posterior distribution 1: P r x = ∝ 1: t t ( P r x P r x 1: 1: t t t t 1: ( , , , 1 1: 1 t t t t r − 1 t ∝ ( , , ) ( P r , ) P r x r x x − − − 1 1: 1 1: 1 t t t t t t r − 1 t ∝ ( ) r t − ( ) ( P x r , ) ( P r ,x ) (1) P r r x − − − − 1 1 1 1 1: 1 t t t t t t r − 1 t Here, P (rt|rt−1) is a prior probability, the joint distribution P (rt, x1:t) is called growth probability and ( ) r t − ( , ) P x r x is a − 1 1 t t predictive probability., we pick the rtwith the largest posterior probability, which rtis also associated with the largest joint distribution in recent data. Next, the prior distribution P (rt|rt−1) and the predictive distribution ( ) r t ( , ) P x r x is defined − 1 t t in following steps. The run length has two directions: one direction is that no change point happens at time t and rt= rt−1 + 1, which means the new data still stays in the same group and follows the same distribution; another direction is that a change point occurs, rt drop to 0 with probability H(rt) = 1/λ. Here, H(rt) is hazard function based on geometric distribution with parameter λ [20]. The prior distribution is: ( ) 0 ( ) 1 ( ) 1 0 otherwise The probability 1 ( , ) t t t P x r x + is a marginal distribution that integral the parameter vector θ correspond to the current run length rt. The rtdepends on the recent data set x(r), which set keep the homogeneous observations and the generated distribution won’t change with time. Define the predictive probability as follows: ( ) ( ) ( ) 1 1 ( , ) ( ) ( , ) t t t t t t t P x r x P x P r x d + + = θ θ = θ θ ∫ Here, θ(r) is the parameter of current run length. Assume the tri-dimensions sensor data xt= (xt1, xt2, xt3)Tfollow three multiple normal distributions with mean µ and inverse- covariance matrix Ω = Σ−1 and dimension d = 3. The likelihood function of n data points is described as follows: 1 ( , ) (2 ) exp( ( ) ( 2 1 exp( ( ) ( )) 2 i = For the prior distribution P (µ, Ω), assume µ∼ N (µ0, (κ0Ω)−1) normal distribution and distribution, so the prior distribution of combining both unknown parameters are: 1 ( , , , , ) exp( ( ) ( )( 2 exp( ( ) / 2) tr T × − Ω Hence, the posterior distribution is: ( , ) t P X P P ∝ µ Ω µ Ω ∝ ℵ µ µ κ Ω υ = H r H r if r if r − 1 t t = − = + (2) P r r r − − − 1 1 1 t t t t t ( ) r r r r (3) t ∑ /2 t − µ Ω = π Ω − − µ Ω − µ /2 nd T )) (4) P X x x 1: t i i = 1 i t ∑ /2 t ∝ Ω − − µ Ω − µ T (5) x x i i 1 Ω υ ~ ( , ) W T Wishart 0 0 di υ − − 1/2 ( 1)/2 d µ Ω µ κ υ ∝ Ω − µ − µ κΩ µ − µ Ω T )) (6) P T 0 0 0 0 0 0 0 (7) µ Ω (8) 1: (X , ) ( , ) (9) 1: t ( , ) ( , ) (10) W T t t i t t d @ IJTSRD | Unique Paper ID – IJTSRD29550 | Volume – 4 | Issue – 1 | November-December 2019 Page 535
International Journal of Trend in Scientific Research and Development (IJTSRD) @ www.ijtsrd.com eISSN: 2456-6470 where, κ = κ + κ µ + µ = t 0 t t X t t 0 0 t κ + t + ∑ 0 υ = υ + T T = κ + κ 0 t − − T ( )(X ) (11) X X X t t 0 t i i t µ − µ − T 0 + ( )( ) (12) X X t t 0 0 t 0 Therefore, the update step for every one new data. κt+1 = κt+ 1 X + + µ = κ + 1 t t + υ = υ + ( )( 1 t κ + Finally, the posterior predictive probability is κ µ + 1 t t t 1 t 1 t 1 κ − µ − µ T ) X X = + + 1 1 t t t t t (13) T + 1 t κ + ( 1) + T = µ r t t ( , ) r ( , ) (14) P X X t + υ − + 1 1 t t t d t κ υ − ( 1) d t t t When new data comes, the algorithm updates parameter and the joint distribution posterior distribution P (rt|x1:t). This Bayesian method create t posterior distributions { iteration time t, to pick up the rt with highest posterior probability. If defined as a change point. More detail is shown in Appendix. Adjust Bayesian Online Method Time consumption is one of the important issues of theBayesian online algorithm because the computing time islinear with the number of observations, which makes computing time being linearly increasing with time. Here, weintroduce sliding window method that is used to constructa fixed window size N, which is so large that includes atleast a few activity segments.In this experiment we takeN = 10000, that’s equivalent to 200s. Depending on differentdata set, we could choose larger N especially in cases where asingle activity takes more time. The adjusted Bayesian online method is to re-initial all parameters when starting a newsliding window and eliminates all old parameter informationof last sliding window. The algorithm of adjusted Bayesianonline segmenting shows in Fig 2. ( , ), P r x which approximates to } : 1 t i t i P r x 1: t t t ( ) = at every tr change to 0 that means a new segment, xt is @ IJTSRD | Unique Paper ID – IJTSRD29550 | Volume – 4 | Issue – 1 | November-December 2019 Page 536
International Journal of Trend in Scientific Research and Development (IJTSRD) @ www.ijtsrd.com eISSN: 2456-6470 B.two-layer Classification In this experiment, instead of extracting features from every small segment, such as 2s, we consider extracting features from the entire activity time segment constructed automatically by Bayesian Online Detection method. One reason for considering the feature of a whole segment is that less feature calculation than feature computation of every 2s. Another reason is to classify the whole sequence rather than classifying a subsequence that contains less information of the activity process. In addition to the three-dimensional data (xi, yi, zi), there is another important measurement: the distance of an observation to = + + 2 i 2 i 2 i d x y z the original point (0, 0, 0) called magnitude, which is defined as . i The feature we used here are following six types criterion: 1.Average of (xi, yi, zi, di); 2.Standard deviation of (xi, yi, zi, di); 3.Average of local maximum of (xi, yi, zi, di); 4.Average of time difference between two consecutive localmaximums of (xi, yi, zi, di); 5.Skewness of (xi, yi, zi); 6.Kurtosis of (xi, yi, zi). The observation can approximate as a periodic wave, andthe repetitive peaks can regard as one of the characteristics that are used to distinguish different axes of different activities[12]. Because the waves of dynamic activities repeat quickerthan static activities, the time gap between two consecutivepeaks of dynamic activities is shorter than static activities.The time gap between two consecutive peaks is also used asthe indexes to distinguish the activities. After segmenting time series, this algorithm trains two-layer classification. The first layer classifies the activitiesinto two categories: dynamic activities (walking, walkingupstairs, walking downstairs) and static activity (standing,sitting, lying). The training features of first layer classificationonly include the first four criterion of di: average, standard deviation, average of local maximum and average of timedifference between two consecutive local maximums. These criterion of di are the most essential factors to distinguishdynamic and static patterns. For the second layer classification,there are two separated classification processes. One classifiertrains and tests only on dynamic activity results into threeclasses: walking, upstairs and downstairs. Another classifiertrains and tests on static activity that also result in threeclasses: sitting, standing and lying. Here, we apply randomforest as the classification method, which is the most widelyused classifier and suitable for many types of data [14]. The two-layer classification algorithm 1is displayed in Fig 3. Algorithm 1 two-layer Classification algorithm 1: procedure GENERATED NEW SEGMENT 2: Create features from generated new segment x(r) 3: Predict the activity of new segment set using the firstlayer features 4: If the predictive label from step 3 is dynamic activities, go to step 5; if the predictive label is static activities, goto step 6; 5: Predict the activity of new segment set using secondlayer features considering dynamic activities 6: Predict the activity of new segment set using secondlayer features considering static activities 7:end procedure III.EXPERIMENT The data source is provided by [21], where the experiments have been carried out with a group of 30 volunteers. They performed a protocol of activities composed of sixdaily activities: three static postures (standing, sitting, lying)and three dynamic activities (walking, walking downstairsand walking upstairs). All the participants were wearing a smartphone (Samsung Galaxy S II) on the waist during the experiment execution. The captured 3-axial linear acceleration. Randomly choose 200s observations of a few volunteers toshow the tri-axis observation of six activities in Fig 4. Itis relatively easy to distinguish dynamic activities and staticactivities because the dynamic activities have stronger fluctuation than static activities. However, it is a challenge toidentify the walking, walking upstairs and walking downstairsin the dynamic group, as well as identifying sitting, standingand laying in the static group. Also, volunteers generate theirparticular wave stream that observations are entirely differentwith each other when they even perform the same action. Forinstance, in Fig4 testing, the z-axis data of around first 80s isless fluctuating than the z-axis data from 80s to 120s. On theother hand, the observations of different activities exhibitedfrom different persons that could be same. Therefore, thecombination of the sensor data from all volunteers is difficultto be detected due to the differences in the pattern. The reasonof training on combining data is that prototype created by suchtraining set generally can be applied so that the user does notrequire to record the start and stop time for specific activities. @ IJTSRD | Unique Paper ID – IJTSRD29550 | Volume – 4 | Issue – 1 | November-December 2019 Page 537
International Journal of Trend in Scientific Research and Development (IJTSRD) @ www.ijtsrd.com eISSN: 2456-6470 The obtained dataset was randomly partitioned into two sets,where 70% of the data was selected as training data and 30%as the test data. The training set is applied to train two-layer random forest to get the prototypes model. Subsequently, the model is used to classify the online segments using Bayesianonline segmentation discussed before and come with a classlabel as output. First of all, let’s check the automaticallysegmenting confusion matrix result in Table I using Bayesian online segmentation algorithm, those errors are caused bysegmenting bias and delay with real boundaries. Here, we usethe majority vote to label the class of each segment. In Table I, the average error rate of bias and delay is 3.55%,which shows this algorithm can automatically and efficiently detect changing activities and find time interval for each of the activities. To comparewith Bayesian online segmentation method, we use SlidingWindow and Bottom-up (SWAB) [22] online segmentationalgorithm as the optional choice. The SWAB is to processbottom-up algorithm during a large enough sliding windowthat can include a few segments. Unlike the Bayesian method,SWAB requires defining initial minimal segmentation lengthand final merged number of segments. In Table II, we displayoverall accuracy based on the different scale of minimumlength and number of segments. The accuracy is increasing aslong as we increase the number of segments and increase theminimum length. However, increasing both criteria will resultin segmentation meaningless. Therefore, we are uncertain tochoose the best option. Compared with that, the Bayesianmethod has less pre-defined requirements and hence moredesirable. TABLE I Bayesian Online Segmentation Confusion Matrix Walking Walking Upstairs Walking Downstairs Sitting Standing Walking 1 0 Walking Upstairs 0 0.9601 Walking Downstairs 0 0.0451 Sitting 0 0 Standing 0 0 Lying 0 0 TABLE II SWAB OVERALL ACCURACY min len = 2 min len = 5 min len = 10 min len = 20 min len = 30 numseg= 25 0.8417 0.8444 numseg= 50 0.8854 0.8914 numseg= 100 0.9227 0.9386 numseg= 200 0.9658 0.9663 Lying 0 0 0 0.0087 0 0.9749 0 0 0 0 0 0 0 0.0399 0.9549 0 0 0 0.9533 0.0477 0.0078 0.0265 0.9415 0.0058 0.8494 0.9022 0.9514 0.9739 0.8793 0.9329 0.9688 0.9992 0.8991 0.9534 0.9931 0.9981 @ IJTSRD | Unique Paper ID – IJTSRD29550 | Volume – 4 | Issue – 1 | November-December 2019 Page 538
International Journal of Trend in Scientific Research and Development (IJTSRD) @ www.ijtsrd.com eISSN: 2456-6470 Table III shows the testing accuracy of two times classifierbased on Bayesian online segmentation. The overall accuracy is 92.4% for six states, the accuracy of static postures anddynamic activities are 100 % in this experiment. By the overallaccuracy of two groups, we can 100% detect whether the person moves or not. From the estimated change points, wecan estimate the length of time for a person to be active orsedentary. TABLE III ONLINE TWO-LAYER CLASSIFICAION CONFUSION MATRIX Walking Walking Upstairs Walking Downstairs Sitting Standing Lying Walking 26 3 Walking Upstairs 3 50 Walking Downstairs 0 3 Sitting 0 0 Standing 0 0 Lying 0 0 For showing the reasoning of choosing random forest, wecompared the results of training by KNN, and SVM, Boosting with Random forest in Fig5. The overall accuracy of Boostingand Random forest is very close and both higher than other twoalgorithms. Checking the accuracy of every activity, Boostingand Random forest generated result is better than others exceptfor walking upstairs that SVM performs the best. Even thecomplexity of KNN O(nk + nd) (k is a pre-defined numberof classes) shows that KNN is an efficient classificationalgorithm, but KNN provides poor identify result. ConsideringSVM has time complexity O(dn2) that SVM is more effectivein cases where the number of dimensions is greater than thenumber of samples. Taken as a whole, Boosting and Randomforest is the optimal choices. Nonetheless, the time complexityof boosting is O(ndKlog(n)) that is higher than the timecomplexity of random forest O(ndlog(n)). Here, n is thenumber of observation, d is the number of features, and Kis depth. Consider the task of real-time pattern detecting, notonly accuracy is important, but less time consuming is alsoanother criterion. Therefore, the random forest is the betterway to handle our data. Based on Table I segmenting outcomes, we can simultaneously input the result into two times classifier and outputactivity label immediately. 0 1 51 0 0 0 0 0 0 34 5 0 0 0 0 2 30 0 0 0 0 0 1 36 A.Comparing OBS with SWAB This data source is provided by Dr. Tu Yicheng’s Lab atUniversity of South Florida, which is generated by iPhone6 built-in accelerometer with 50Hz. The sensor data is tri-dimensional: x-axis shows the acceleration rate on forth- back direction; y-axis shows the acceleration rate on left-right direction; z-axis shows the acceleration rate on up-down direction. The sensor data include sitting, standing,walking upstairs, walking downstairs, walking and joggingsix activities. However, the label of each activity is unknown.Comparing the change point detecting result by OBS methodin Figure 6 with SWAB state estimation result, the OBSalgorithm does an excellent performance. Fig.6. Acceleration plot of six activities SWAB method is considered as the alternative segmentationmethod comparing with OBS. The length of sliding window is 1000, which is long enough to contain a few activities.Since these data set doesn’t include actual activity labels andit needs visually check whether or not the segmentations areappropriate. SWAB requires the minimum length of starting segments and the fixed number of segments per slidingwindow. Based on the result displayed in Figure 7,8,9 and10, the change point detecting is sensitive to the fluctuatingobservations (observation 2500th to 4500th). Overall, OBS canbe considered as the better choice for activity detecting issue. @ IJTSRD | Unique Paper ID – IJTSRD29550 | Volume – 4 | Issue – 1 | November-December 2019 Page 539
International Journal of Trend in Scientific Research and Development (IJTSRD) @ www.ijtsrd.com eISSN: 2456-6470 CONCLUSION We present a real-time activity recognition algorithm, whichis used to apply on smartphone platform for human activityidentification. We introduce a Bayesian online detection algorithm and two-layer random forest classifier. Rather thanextracting features from small segments that one activity timeinterval might contain a few such segments, this method computes features based on entire activity time interval. Differentclassify layers use different features to avoid meaninglessfeatures and save running time. The first layer aims to distinguish dynamic activities (walking, upstairs and downstairs)and static activities (sitting, standing and lying) using theamplitude as the key feature. The process of the second layer is to distinguish the three behaviors in different categories. However, it is still a big challenge to differentiate walking and walking upstairs very well only based on accelerometer sensor data. We could get a better result with regarding GPS data in the later work. In this work, performance has reached with overall accuracy for six states is 92.4%, and the overallaccuracy for two categories: dynamic activities and staticactivities is 100%. For USF lab data, we cannot check the OBS give better segmenting result that can detect change point appropriately even dynamic activities. Further, OBS method doesn’t need prior information as well as SWAB method such as the number of segments. In the future, a real-time detection activity system can be designed on a smartphone. Since it has been trained and it can automatically detect behavior change, therefore it’s easy to handle without user knowledge of machine learning and instruct smartphone when user change behaviors. Even though the multivariate normality assumptionis bit restrictive, we get good results. We plan to relax this assumption in the future work. Further, we also can extend the set of activity with low frequency and high frequency, such asquick walking, slow walking, fast running, and jogging, etc. APPENDIX The prior distribution of combination of normal distribution and Wishart distribution is: ( , , , , ) ( , ) ( , ) di P T W T µ Ω µ κ υ =ℵ µ µ κ Ω υ 0 0 0 0 0 0 0 0 1 2 υ − − 1/2 ( 1) d − = (2 ) π κ Ω − µ −µ κΩ µ −µ Ω /2 d T exp( ( ) ( )( )) 0 0 0 0 1 2 −υ /2 −υ × − Ω Γ υ d/2 exp( ( ) / 2)2 ( / 2) tr T T 0 0 0 d 1 2 1 2 υ − − 1/2 ( 1) d ∝ Ω − µ −µ κΩ µ −µ Ω − Ω T exp( ( ) ( )( )) exp( ( ) / 2) (15) tr T 0 0 0 For the update step, κµ + + κµ + ( 1) t X tX t + 1 t t µ −µ = − 0 0 κ + + 1 t t κ + + + κ + + −µ κ + 1 t κ − κµ − κ + −µ X tX tX X t = = + + + 1 ( 1 0 1 t t t t κ + 1)( X 1) 1 t t + κ µ X µ = µ + = + + κ + 1 1 t t t t t (16) + 1 t t 1 1 t t @ IJTSRD | Unique Paper ID – IJTSRD29550 | Volume – 4 | Issue – 1 | November-December 2019 Page 540
International Journal of Trend in Scientific Research and Development (IJTSRD) @ www.ijtsrd.com eISSN: 2456-6470 T t T t − = − + + T ( 1) T T X X t X X tX X + + 1 1 t t + + 1 1 ( t t t + 1 t κ + κ + + κ κ + 1)( 1 t T t T t + µ µ − µ + T 2 ) X X X + + + 1 1 1 t 0 0 0 t + − ( 1) t X X t T t T t + 1 t t − µ µ − µ + − + T 1 t ( 2 )( ) X X X X t t 0 0 0 t 1[( Z × T t T t = κ + κ − + κ + κ + 2 2 1) ( 1) ( 1) X X t X X t + + + + 1 1 1 1 t t t t t t T X + − + − ( 1) ( 1) t X X t X X T t + + 1 1 t t t t − κ + κ µ + + 1 1 t t 2 ( 1) t X + 1 0 t + − ( 1) t X + 1 t t 2 ( + κ κ + + κ µ µ + 2 T 1 t 1) ] (17) t 0 0 t where, Z = κ+ + κ+ ( 1[( Z + κ + µ 1)( ) t t T t = κ + + + + κ µ µ − κ + + 2 2 2 T t T t T 1) ( 1) 2( 1)( 1) X X t X X t X X + + 1 1 t + + + + 1 1 1 1 0 0 t t t t − κ κ + µ T t 2 ( 1[( Z κ 1) 2 ( 1) ] t X X + 1 t + 0 0 1 t = κ + − + − κµ κ + − + − κµ T 1) ( 1) ][( 1) ( 1) ] X t X X t X + + 1 1 t t + + 1 0 1 0 t t t t −µ −µ T ( )( ) X X = + + 1 1 t t t t t (18) κ + 1 t REFERENCES [1]“Ericsson mobility report: 70 percent of world’s population using smartphones https://www.ericsson.com/news/1925907, 2015. machine,” in International Workshop on Ambient Assisted Living. Springer, 2012, pp. 216–223. by 2020,” June [8]P. Casale, O. Pujol, and P. Radeva, “Human activity recognition from accelerometer data using a wearable device,” in Iberian Conference on Pattern Recognition and Image Analysis. Springer, 2011, pp. 289–296. [2]F. Foerster, M. Smeja, and J. Fahrenberg, “Detection of posture and motion by accelerometry: a validation study in ambulatory monitoring,” Computers in Human Behavior, vol. 15, no. 5, pp. 571–583, 1999. [9]D. Vishwakarma, P. Rawat, and R. Kapoor, “Human activity recognition using gabor wavelet transform and ridgelet transform,” Procedia Computer Science, vol. 57, pp. 630–636, 2015. [3]L. Bao and S. S. Intille, “Activity recognition from user-annotated acceleration data,” in International Conference on Pervasive Computing. Springer, 2004, pp. 1–17. [10]O. D. Lara and M. A. Labrador, “A survey on human activity recognition using wearable sensors,” IEEE Communications Surveys & Tutorials, vol. 15, no. 3, pp. 1192–1209, 2013. [4]J. Cheng, O. Amft, and P. Lukowicz, “Active capacitive sensing: Exploring a new wearable sensing modality for activity recognition,” in International Conference on Pervasive Computing. Springer, 2010, pp. 319– 336. [11]A. D. Ignatov and V. V. Strijov, “Human activity recognition using quasiperiodic time series collected from a single tri-axial accelerometer,” Multimedia Tools and Applications, pp. 1–14, 2015. [5]M. Ermes, J. Parkka, and L. Cluitmans, “Advancing from offline to online activity recognition with wearable sensors,” International Conference of the IEEE Engineering in Medicine and Biology Society. IEEE, 2008, pp. 4451– 4454. [12]J. R. Kwapisz, G. M. Weiss, and S. A. Moore, “Activity recognition using cell phone accelerometers,” ACM SigKDD Explorations Newsletter, vol. 12, no. 2, pp. 74–82, 2011. in 2008 30th Annual [13]J.-L. Reyes-Ortiz, L. Oneto, A. Ghio, A. Sama, D. Anguita, and X. Parra, “Human activity recognition on smartphones with awareness of basic activities and postural transitions,” in International Conference on Artificial Neural Networks. Springer, 2014, pp. 177– 184. [6]D. Anguita, A. Ghio, L. Oneto, X. Parra, and J. L. Reyes- Ortiz, “Energy efficient smartphone-based activity recognition using fixedpoint arithmetic,” J. UCS, vol. 19, no. 9, pp. 1295–1314, 2013. [7]——, “Human activity recognition on smartphones using a multiclass hardware-friendly support vector @ IJTSRD | Unique Paper ID – IJTSRD29550 | Volume – 4 | Issue – 1 | November-December 2019 Page 541
International Journal of Trend in Scientific Research and Development (IJTSRD) @ www.ijtsrd.com eISSN: 2456-6470 [14]M. Shoaib, S. Bosch, O. D. Incel, H. Scholten, and P. J. Havinga, “A survey of online activity recognition using mobile phones,” Sensors, vol. 15, no. 1, pp. 2059–2085, 2015. on-body accelerometers,” Sensors, vol. 10, no. 2, pp. 1154–1175, 2010. [19]R. P. Adams and D. J. MacKay, “Bayesian online changepoint detection,” 0710.3742, 2007. arXiv preprint arXiv: [15]G. James, D. Witten, T. Hastie, and R. Tibshirani, “An introduction to statistical learning,” vol. 6, 2013. [20]P. A. Tobias and D. Trindade, Applied reliability. CRC Press, 2011. [16]M. Mohri, A. Rostamizadeh, and A. Talwalkar, Foundations of machine learning. MIT press, 2012. [21]J.-L. Reyes-Ortiz, L. Oneto, S. Albert, X. Parra, and D. Anguita, “Transition-aware recognition using smartphones,” Neurocomputing, vol. 171, pp. 754–767, 2016. [17]A. Avci, S. Bosch, M. Marin-Perianu, R. Marin-Perianu, and P. Havinga, “Activity recognition using inertial sensing for healthcare, wellbeing and sports applications: A survey,” in Architecture of computing systems (ARCS), 2010 23rd international conference on. VDE, 2010, pp. 1–10. human activity [22]E. Keogh, S. Chu, D. Hart, and M. Pazzani, “An online algorithm for segmenting time series,” in Data Mining, 2001. ICDM 2001, Proceedings IEEE International Conference on. IEEE, 2001, pp. 289– 296. [18]A. Mannini and A. M. Sabatini, “Machine learning methods for classifying human physical activity from @ IJTSRD | Unique Paper ID – IJTSRD29550 | Volume – 4 | Issue – 1 | November-December 2019 Page 542