Download
1 / 6
60 likes | 118 Views
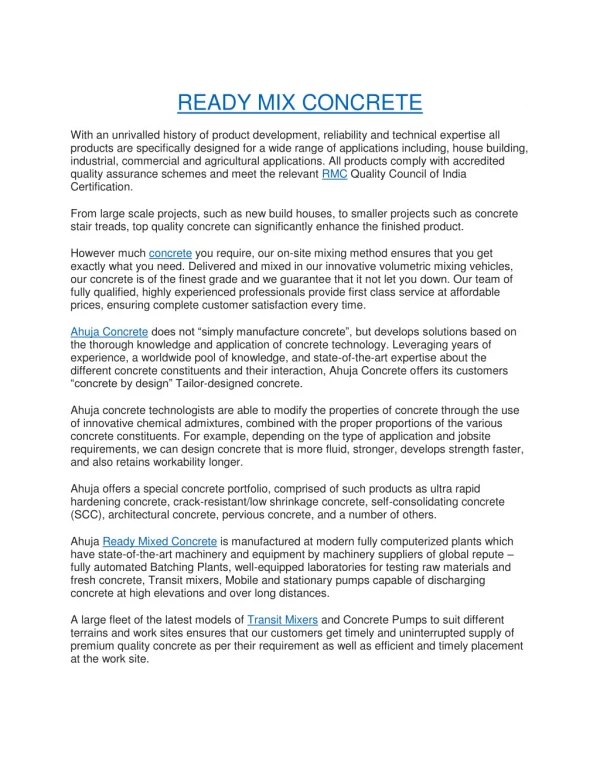
In civil engineering, on site concrete mixing is very important .To determine compressive strength of concrete mix, statistical method is very useful. Regression analysis is an effective statistical technique. By analysing the laboratory concrete block cylinder tests , we can determine not only the correlation between compressive strength at different curing ages of concrete but also variation in material properties, ratios and variation in of fly ash as a partial replacement of concrete. Manisha S. Kukade | Trupti S. Joshi | Sumit D. Sanghani "Concept of Regression Analysis in Concrete Mix Design" Published in International Journal of Trend in Scientific Research and Development (ijtsrd), ISSN: 2456-6470, Volume-2 | Issue-2 , February 2018, URL: https://www.ijtsrd.com/papers/ijtsrd10708.pdf Paper URL: http://www.ijtsrd.com/engineering/civil-engineering/10708/concept-of-regression-analysis-in-concrete-mix-design/manisha-s-kukade<br>

E N D
International Research Research and Development (IJTSRD) International Open Access Journal f Regression Analysis in Concrete Mix Design n Concrete Mix Design International Journal of Trend in Scientific Scientific (IJTSRD) International Open Access Journal ISSN No: 2456 ISSN No: 2456 - 6470 | www.ijtsrd.com | Volume | www.ijtsrd.com | Volume - 2 | Issue – 2 Concept of Regression Analysis Trupti S. Joshi, Manisha S. Kukade U.G. Student, Department of Civil Engineering, U.G. Student, Department of Civil Engineering, Sinhgad Academy of Engineering Pune, Mahashtra, India ti S. Joshi, Manisha S. Kukade, Sumit D. Sanghani Sinhgad Academy of Engineering, ABSTRACT In civil engineering, on site concrete mixing is very important .To determine compressive strength of concrete mix, statistical method is very useful. Regression analysis is an effective statistical technique. By analysing the laboratory concrete block/ cylinder tests , we can determine correlation between compressive strength at different curing ages of concrete but also variation in material properties, ratios and variation in % of fly ash as a partial replacement of concrete. Keywords: Statistical analysis, compression s ,concrete mix design , fly ash , correlation between compressive strength and days of curing. I. INTRODUCTION We use concrete as a construction material worldwide. Because of its advantages like low cost, availability of construction, workability and convenient compressive advantages depend on the concrete mix, placing and curing. In construction industry, strength is a primary criterion in selecting a concrete for a particular application .Concrete used for constructio strength over a long period of time after pouring. The characteristics strength of concrete is defined as the compressive strength of a sample that has been aged for 90 days. oncrete mixing is very The aim of the present study is to predict compressive te for a given samples made by using industrial waste fly ash as a partial replacement of cement of different hoppers for different concrete grades like M20, M25 and M30 at curing ages of 7, 28 and 90. And finding correlation between them by The aim of the present study is to predict compressive strength of concrete for a given samples made by using industrial waste fly ash as a partial replacement of cement of different hoppers for different concrete grades like M20, M25 and M30 at curing ages of 7, 28 and 90. And finding correlation between them by using regression analysis. important .To determine compressive strength of concrete mix, statistical method is very useful. Regression analysis is an effective statistical technique. By analysing the laboratory concrete block/ cylinder tests , we can determine not only the correlation between compressive strength at different curing ages of concrete but also variation in material properties, ratios and variation in % of fly ash as a In this project, we add fly ash as a partial replacement of concrete. And percentage of fly ash varies from 0% to 37.5%. The work presented in this project reports an investigation on the behaviour of concrete produced from blending cement wit of fly ash are 0%, 12.50%, 25.00% and 37.50% for each hopper of namely 1, 2, 3 for M20, M25 and M30 grades. The utilization of fly ash as cement replacement material in concrete or as additive in cement introduces many benefits from econo technical and environmental point of view. technical and environmental point of view. In this project, we add fly ash as a partial replacement of concrete. And percentage of fly ash varies from 0% to 37.5%. The work presented in this project reports an investigation on the behaviour of concrete produced from blending cement with FA. Percentages of fly ash are 0%, 12.50%, 25.00% and 37.50% for each hopper of namely 1, 2, 3 for M20, M25 and M30 grades. The utilization of fly ash as cement replacement material in concrete or as additive in cement introduces many benefits from economical, Statistical analysis, compression strength ,concrete mix design , fly ash , correlation between We use concrete as a construction material worldwide. Because of its advantages like low cost, availability of construction, workability, durability convenient compressive advantages depend on the concrete mix, placing and curing. In construction industry, strength is a primary criterion in selecting a concrete for a particular application .Concrete used for construction gains strength over a long period of time after pouring. The characteristics strength of concrete is defined as the compressive strength of a sample that has been aged EXPERIMENTAL DATA Since the aim this study is studying the effect of mix proportions on the compressive strength of concrete, different mixes were used. The details of all mix ables below. II. EXPERIMENTAL DATA Since the aim this study is studying the effect of mix proportions on the compressive strength of concrete, different mixes were used. The details of all mix proportions are shown in Tables below. Compressive strength test was performed and evaluated. Specimens were immersed in water until the day of testing at 7, 28 and 90 days. Tables below show the test results. strength. strength. These These Compressive strength test was performed and evaluated. Specimens were immersed in water until the day of testing at 7, 28 and 90 days. Tables below @ IJTSRD | Available Online @ www.ijtsrd.com @ IJTSRD | Available Online @ www.ijtsrd.com | Volume – 2 | Issue – 2 | Jan-Feb 2018 Feb 2018 Page: 1412
International Journal of Trend in Scientific Research and Development (IJTSRD) ISSN: 2456-6470 TABLE I : PHYSICAL PROPERTIES Cement Hopper No: 1 3.15 …. Test Conducted Specific gravity (gm/cc) Fineness % by wt by sieving (%retention on 45 micron sieve-wet sieving) Fineness surface)(Sq.m./kg) By Blains Air Permeability Hopper No:2 2.061 24.45 Hopper No:3 2.173 2.70 2.040 45.55 …. 229 320 536 (specific QUANTITIES FOR M20 GRADE OF CONCRETE Same for hopper no 1 , 2 and 3 1 CEMENT(Kg/m3) 383 FA(%) 00.00 FA(Kg/m3) 00.00 CEMENT(Kg/m3) 383.00 SAND(Kg/m3) 559.00 AGG(Kg/m3) 1213.00 WATER (Lit) 186.71 Sr no 2 3 4 383 12.50 47.87 335.13 559.00 1213.00 186.71 383 25.00 95.75 287.25 559.00 1213.00 186.71 383 37.50 124.47 258.53 559.00 1213.00 186.71 QUANTITIES FOR M25 GRADE OF CONCRETE: Same for hopper no 1 , 2 and 3 1 2 CEMENT(Kg/m3) 456 FA(%) 00.00 FA(Kg/m3) 00.00 CEMENT(Kg/m3) 456.00 SAND(Kg/m3) 540.00 AGG(Kg/m3) 1171.00 WATER (Lit) 186.877 Sr no 3 456 25.00 114.00 342.00 540.00 1171.00 186.877 4 456 37.50 171.00 285.00 540.00 1171.00 186.877 456 12.50 57.00 399.00 540.000 1171.00 186.877 QUANTITIES FOR M30 GRADE OF CONCRETE Same for hopper no 1 , 2 and 3 1 2 CEMENT(Kg/m3) 479 FA(%) 00.00 FA(Kg/m3) 00.00 CEMENT(Kg/m3) 479.00 SAND(Kg/m3) 534.00 AGG(Kg/m3) 1132.00 WATER (Lit) 186.80 Sr no 3 479 25.00 119.75 359.25 534.00 1132.00 186.80 4 479 37.50 179.625 299.375 534.00 1132.00 186.80 479 12.50 59.875 419.125 534.00 1132.00 186.80 @ IJTSRD | Available Online @ www.ijtsrd.com | Volume – 2 | Issue – 2 | Jan-Feb 2018 Page: 1413
International Journal of Trend in Scientific Research and Development (IJTSRD) ISSN: 2456-6470 III. RESULTS AND DISCUSSION FOR HOPPER NO:1 [M20 GRADE] Sr. No. 7 Day 28 Day 90Day Square of Coeff. of Correlation Equation 1 2 3 4 20.15 27.71 28.30 0.548 18.22 23.50 26.23 0.803 17.92 24.67 28.89 0.841 17.92 22.97 25.34 0.784 Y=0.07 8X+22. 13 24.314 Y=0.08 4X+19. 12 21.472 Y=0.117X +18.92 Y=0.077X +18.83 22.196 20.986 Prediscted For 28 Day C.S. FOR HOPPER NO:1 [M25 GRADE] Sr. No. 7 Day 28 Day 90Day Square of Coeff. of Correlation Equation 5 6 7 8 21.63 35.85 36.89 0.544 17.63 30.82 29.71 0.408 17.92 31.41 33.63 0.154 18.82 26.52 32.00 0.866 Y=0.145X +25.38 29.41 Y=0.108X +21.53 24.554 Y=0.062X+ 22.69 24.426 Y=0.142X +19.83 23.806 Prediscted For 28 Day C.S. FOR HOPPER NO:1 [M30 GRADE] Sr. No. 7 Day 28 Day 90Day Square of Coeff. of Correlation Equation 9 31.11 41.78 43.26 0.595 10 29.03 32.15 35.70 0.943 11 27.70 34.97 40.59 0.881 12 20.74 28.75 40.00 0.967 Y=0.118X +33.777 37.074 Y=0.075X +29.16 31.26 Y=0.140X+ 28.56 32.56 Y=0.220X +20.64 26.80 Prediscted For 28 Day C.S. FOR HOPPER NO:2 [M20 GRADE] Sr. No. 7 Day 28 Day 90Day Square of Coeff. of Correlation Equation 13 20.15 27.71 28.30 0.548 14 18.50 24.60 27.56 0.790 15 18.37 27.27 29.78 0.690 16 17.77 25.34 26.52 0.607 Y=0.078X +22.13 24.314 Y=0.095X +19.58 22.24 Y=0.115X+ 20.33 23.55 Y=0.085+1 9.63 22.01 Prediscted For 28 Day C.S. @ IJTSRD | Available Online @ www.ijtsrd.com | Volume – 2 | Issue – 2 | Jan-Feb 2018 Page: 1414
International Journal of Trend in Scientific Research and Development (IJTSRD) ISSN: 2456-6470 FOR HOPPER NO:2 [M25 GRADE] Sr. No. 7 Day 28 Day 90Day Square of Coeff. of Correlation Equation 17 18 19 20 21.63 35.85 36.89 0.544 21.56 32.60 35.71 0.689 20.74 32.23 37.04 0.761 18.87 29.04 31.41 0.659 Y=0.145X +25.38 29.44 Y=0.143X +23.99 27.994 Y=0.169X+ 22.94 27.672 Y=0.125X +21.21 24.71 Prediscted For 28 Day C.S. FOR HOPPER NO:2 [M30 GRADE] Sr. No. 7 Day 28 Day 90Day Square of Coeff. of Correlation Equation 21 31.11 41.78 43.26 0.595 22 29.50 35.70 37.49 0.693 23 28.50 32.89 41.03 0.989 24 21.70 29.19 41.04 0.978 Y=0.118X +33.77 37.074 Y=0.080X +30.85 33.09 Y=0.146X+ 28.03 32.118 Y=0.223X +21.33 27.574 Prediscted For 28 Day C.S. HOPPER NO:3 [M20 GRADE] 25 26 20.15 19.00 27.71 24.60 28.30 28.15 0.548 0.843 Sr. No. 7 Day 28 Day 90Day Square of Coeff. of Correlation Equation 27 19.11 28.30 31.56 0.730 28 18.07 26.60 26.97 0.520 Y=0.078X +22.13 24.314 Y=0.098X +19.82 22.564 Y=0.127X+ 20.99 24.546 Y=0.084X +20.37 22.722 Prediscted For 28 Day C.S. M25 GRADE 30 23.64 36.60 39.26 0.641 Sr. No. 7 Day 28 Day 90Day Square of Coeff. of Correlation Equation 29 21.63 35.85 36.89 0.544 31 21.48 33.56 38.07 0.739 32 18.96 31.26 32.45 0.563 Y=0.145X +25.38 29.44 Y=0.155X +26.70 31.04 Y=0.171X+ 23.91 28.698 Y=0.129X +22.14 25.752 Prediscted For 28 Day C.S. @ IJTSRD | Available Online @ www.ijtsrd.com | Volume – 2 | Issue – 2 | Jan-Feb 2018 Page: 1415
International Journal of Trend in Scientific Research and Development (IJTSRD) ISSN: 24 International Journal of Trend in Scientific Research and Development (IJTSRD) ISSN: 24 International Journal of Trend in Scientific Research and Development (IJTSRD) ISSN: 2456-6470 M30 GRADE 34 29.78 33.64 43.26 0.998 Sr. No. 7 Day 28 Day 90Day Square of Coeff. of Correlation Equation 33 31.11 41.78 43.26 0.595 35 29.78 36.89 42.97 0.899 36 22.52 32.45 41.18 36 22.52 32.45 41.18 0.904 0.904 Y=0.118X +33.77 +33.77 37.074 Y=0.118X Y=0.160X +28.86 33.34 Y=0.145X+ 30.50 34.56 Y=0.205X +23.47 Y=0.205X +23.47 29.21 29.21 Prediscted For 28 Day C.S. Fig.Days vs comp. Strength graph with equation and correlation coefficient. comp. Strength graph with equation and correlation coefficient. comp. Strength graph with equation and correlation coefficient. IV. CONCLUSION I 1)A Correlation greater than 0.8 is generally described as strong, whereas a correlation less than 0.5 is generally described as weak. 2)As we get coefficient of correlation by using regression analysis, more is the coefficient of correlation; more is the predicted compressive strength. If coefficient of correlation is nearer to 0.999, predicted values became observed. 3)Also, for higher grade of concrete we have greater coefficient of correlation. 4)For M20 grade , minimum coefficient of correlation is 0.520 and maximum is 0.843 5)For M25 grade, minimum coefficient of correlation is 0.154 and maximum is 0.866 6)For M30 grade, minimum coefficient correlation is 0.544 and maximum is 0.989. correlation is 0.544 and maximum is 0.989. A Correlation greater than 0.8 is generally described as strong, whereas a correlation less than 0.5 is generally described as weak. coefficient of correlation by using regression analysis, more is the coefficient of correlation; more is the predicted compressive strength. If coefficient of correlation is nearer to 0.999, predicted values became observed. II 1)Coefficient of correlation lies between 2)When it is nearer 0.999efficiency of getting accurate compressive strength of concrete is more. 3)Coefficient of correlation lies between 0.5 to 0. results i.e. predicted values at 28th day compressive strength have difference of 2 N/mm2 to 3 N/mm2 than observed values. III 1)By deriving equation, we can predict the values of compressive strength at any curing days like 28th day. 2)We get more deviated equation when coefficient of correlation is less. Coefficient of correlation lies between -1 to 1. When it is nearer 0.999efficiency of getting accurate compressive strength of concrete is more. Coefficient of correlation lies between 0.5 to 0.7, results i.e. predicted values at 28th day compressive strength have difference of 2 N/mm2 to 3 N/mm2 than observed values. oncrete we have greater For M20 grade , minimum coefficient of correlation is 0.520 and maximum is 0.843 For M25 grade, minimum coefficient of correlation is 0.154 and maximum is 0.866 For M30 grade, minimum coefficient of By deriving equation, we can predict the values of compressive strength at any curing days like 28th eviated equation when coefficient @ IJTSRD | Available Online @ www.ijtsrd.com @ IJTSRD | Available Online @ www.ijtsrd.com | Volume – 2 | Issue – 2 | Jan-Feb 2018 Feb 2018 Page: 1416
International Journal of Trend in Scientific Research and Development (IJTSRD) ISSN: 2456-6470 4) Hasan M.M. and Kabir A., Prediction of Compressive Strength of Concrete from Early Age Test Result. Proceedings of 4thAnnual Paper Meet and 1st Civil Engineering Congress, Dhaka,Bangladesh, December 22-24, 2011, pp. 1- 7 3)And relatively accurate equation when we have large coefficient of correlation. 4)Eg. In 34th result. Observed compressive strength is 33.64 and that of predicted value is 33.34 and having coefficient of correlation 0.998 when Fly ash mixing is 12.5%. V. SUMMARY 5) Ahsanul Kabir, Monjurul Hasan2 AND MD. Khasro Miah, Predicting 28 Days Compressive Strength of Concrete from 7 Days Test Result ,Bangladesh University of Engg. & Tech. /Dept. of Civil Engineering, Dhaka, Bangladesh In this way, regression analysis helps to predict compressive strength at any stage of curing days and correlation between compressive strength at different stages. VI. REFERENCES 6) M. F. M. Zain1, Suhad M. Abd, K. Sopian, M. Jamil, Che-Ani A.I , Mathematical Regression Model for the Prediction Strength,Faculty of Engineering and Built Environment, Solar Energy Research Institute, UniversitiKebangsaan Malaysia, 43600 UKM Bangi, Selangor DarulEhsan, Malaysia . of Concrete 1) Suhad M.A., Mathematical model for the prediction of cement compressive strength at the ages of 7&28 days within 24 hours, MSc Thesis, Al-Mustansiriya University, engineering, civil engineering department, 2001. college of 7) Palika Chopra, DR. R K Sharma, DR. Maneekkumar , Regression models for the prediction of compressive strength of concrete with and without fly ash , thapar university , Patiala-147004. 2) Sandorpopovics, Analysis of Concrete Strength Versus Water-Cement Ratio Relationship, ACI Material Journal,Vol.87, October 1990, Pp.517-529 No.5, September- 8) Dinesh.W. Gawatre & V.G.Meshram , Study Of Various Fineness Of Fly Ash As A Partial Replacement Of Cement International Journal of Scientific & Engineering Research Volume 4, Issue 1, January-2013 .PP 01-07 3) Kheder M.A.,Mathematical model for the prediction of cement compressive strength at the ages of 7&28 days within 24 structures2003. 36: 693-701 G.F.,AL-Gabban A.M. &Suhad Concrete In materials hour and @ IJTSRD | Available Online @ www.ijtsrd.com | Volume – 2 | Issue – 2 | Jan-Feb 2018 Page: 1417