Download
1 / 4
40 likes | 67 Views
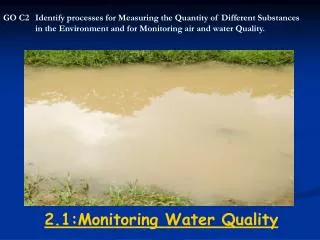
Water is important resource in our life. It plays vital role in our human life, animals and eco system.But, Now a days water had polluted due to human activities. For that purpose, it is important to measure and monitor the quality of water. This survey describes, what the techniques available to measure are and monitor quality of water. T. Umamaheswari | Dr. M. Newlin Rajkumar | R. Tharani | S.Rajalakshmi "Water Quality Measuring and Monitoring: A Survey" Published in International Journal of Trend in Scientific Research and Development (ijtsrd), ISSN: 2456-6470, Volume-2 | Issue-1 , December 2017, URL: https://www.ijtsrd.com/papers/ijtsrd5833.pdf Paper URL: http://www.ijtsrd.com/engineering/computer-engineering/5833/water-quality-measuring-and-monitoring-a-survey/t-umamaheswari<br>

E N D
International Research Research and Development (IJTSRD) International Open Access Journal Water Quality Measuring and Monitoring: A Survey International Journal of Trend in Scientific Scientific (IJTSRD) International Open Access Journal ISSN No: 2456 ISSN No: 2456 - 6470 | www.ijtsrd.com | Volume | www.ijtsrd.com | Volume - 2 | Issue – 1 Water Quality Measuring a T. Umamaheswari Department of CSE, Anna University Regional Campus, Coimbatore, India R. Tharani Department of CSE, Anna University Regional Campus, Coimbatore, India Campus, Coimbatore, India Monitoring: A Survey Dr. M. Newlin Rajkumar Department of CSE, Anna University Regional Campus, Coimbatore, India S. Rajalakshmi Department of CSE, Anna University Regional Campus, Coimbatore, India Campus, Coimbatore, India Newlin Rajkumar of CSE, Anna University Regional Campus, Coimbatore, India Department of CSE, Anna University Regional Campus, Coimbatore, India Rajalakshmi Department of CSE, Anna University Regional Department of CSE, Anna University Regional ABSTRACT Water is important resource in our life. role in our human life, animals and eco system. Now-a-days water had polluted due to human activities. For that purpose, it is important to measure and monitor the quality of water. This survey describes, what the techniques available are and monitor quality of water. assessing water quality. Based on the temperature the physical and chemical parameters of water can also be changed. Sometimes the metabolic rates and ies of aquatic organisms can get assessing water quality. Based on the temperature the physical and chemical parameters of water can also be changed. Sometimes the metabolic rates and biological activities of aquatic organisms can get affected due to temperature of water. affected due to temperature of water. Water is important resource in our life. It plays vital role in our human life, animals and eco system. But, days water had polluted due to human activities. For that purpose, it is important to measure and monitor the quality of water. This survey describes, what the techniques available to measure Turbidity [1] is an optical determination of water clarity. Turbid water will appear cloudy, muddy, or otherwise colored, affecting the physical turbidit based on the amount of light spread by particles in the water column. More light will be scattered when more particles are The water can be turbid due to presence of silt or clay, inorganic materials, or organic matter ankton and decaying matter. Due to this the light penetration in the top most layer is Turbidity: Turbidity [1] is an optical determination of water clarity. Turbid water will appear cloudy, muddy, or otherwise colored, affecting the physical look of the water. The turbidit light spread by particles in the water column. More light will be scattered when more particles are present. The water can be turbid due to presence of silt or clay, inorganic materials, or organic matter such as algae, plankton and decaying matter. Due to this the light penetration in the top most layer is reduced. Keywords: Temperature, dissolved oxygen, pH, salinity : Temperature, dissolved oxygen, pH, I. INTRODUCTION Water quality is considered to be an important part of environmental monitoring. When water quality is poor the whole surroundings get affected. Here we discuss about the parameters that affect the quality of water in the environment. These properties can physical, chemical or biological factors [1]. Properties of water quality include temperature and turbidity [1], pH and dissolved oxygen phytoplankton [1]. Those parameters are related not only to surface water and also include ocean, la and rivers. By monitoring the quality of Water facilitates to researchers to predict and learn from natural processes in the environment and determine human impacts on an ecosystem. Water quality is considered to be an important part of environmental monitoring. When water quality is poor the whole surroundings get affected. Here we discuss about the parameters that affect the quality of water in the environment. These properties can be physical, chemical or biological factors [1]. Properties of water quality include temperature and turbidity [1], pH and dissolved oxygen phytoplankton [1]. Those parameters are related not only to surface water and also include ocean, lakes monitoring the quality of Water, it facilitates to researchers to predict and learn from natural processes in the environment and determine B.Chemical Parameters pH [1] is a determined value based on a defined scale, similar to temperature. This means that pH of water can be measured as a concentration or in a quantity. More acidic the water is lesser than the level, higher the number, the more basic it is. A pH of pH: pH [1] is a determined value based on a defined scale, similar to temperature. This means that pH of water can be measured as a concentration or in a quantity. More acidic the water is lesser than the level, higher the number, the more basic it is. A pH o 7 is considered neutral. [1], [1], algae algae and and Dissolved Oxygen: II. Water Quality Parameters Dissolved oxygen refers to the level of free non- compound oxygen present in water or other liquids. In the study of lakes, dissolved oxygen is an essential Dissolved oxygen refers to the level of free non compound oxygen present in water or other liquids. the study of lakes, dissolved oxygen is an essential factor second only to water itself. factor second only to water itself. A dissolved oxygen A.Physical parameters Temperature: Water temperature [1] is a physical property. It is considered to be an important factor for It is considered to be an important factor for mperature [1] is a physical @ IJTSRD | Available Online @ www.ijtsrd.com @ IJTSRD | Available Online @ www.ijtsrd.com | Volume – 2 | Issue – 1 | Nov-Dec Dec 2017 Page: 27
International Journal of Trend in Scientific Research and Development (IJTSRD) ISSN: 2456-6470 III. Sensors [2] are sophisticated devices that are frequently used to detect and respond to electrical or optical signals. A Sensor converts parameter (for example: temperature, blood pressure, humidity, speed, etc.) into a signal which can be measured electrically. pH Sensor: It measures and monitors the pH levels .If the pH levels low then it can have dangerous effects on human health. The pH of water can vary from 0 to14 [7]. Temperature Sensor: Temperature Sensor [7] measures the temperature of the water and the measured voltage is proportional to the temperature with negative or positive co-efficient. Turbidity Sensor: Turbidity Sensor [7] used to measure the clarity of water or muddiness visible in the water. The output voltage varies represents turbidity value varying from 0 to 4000NTU (Nephelometric Turbidity Unit). Conductivity Sensor: The conductivity of water indicates the amount of ions and /or free flowing electrons which are present for the conduction of electricity. It is measured in Siemens per meter(s/m) or micro Siemens per centimeter. IV. Wireless Sensor Network A wireless sensor network (WSN)[3] is a wireless network consisting of independent devices and uses sensors to monitor the environmental conditions. incorporates a gateway connectivity back to the wired world and distributed nodes The WSN is built of few to several hundred nodes, where each node is coupled to individual (or sometimes several) sensors. Each such sensor network node has typically a radio transceiver with connection to an external antenna, a microcontroller, an electronic circuit for interfacing with the sensors and an energy source. V. Applications Health care monitoring: The sensor networks for medical applications can be of several possible applications include body position measurement, location of persons, overall monitoring of ill patients Sensors [5] level is high or low, it can harm to the aquatic life and affect water quality. Conductivity: Conductivity [5] is a measure of water’s capability to pass electrical flow. This ability is directly related to the concentration of ions in the water. The conductive ions are detected from alkalis, chlorides, sulfides and Compounds that dissolve into ions are also known as electrolytes. The conductivity of water is high, when more ions are present in water. Likewise, the fewer ions that are in the water, is less conductive. This produces the balanced solution. If it is changed, it affects the system. the physical carbonate compounds. Salinity: Salinity [4] is an ambiguous term. As a basic definition, salinity is the total concentration of all dissolved salts in water. There are lot of ions present in freshwater sources. The compositions of water sources are dependent environment, most of the lakes and rivers have alkali and alkaline earth metal salts, with calcium, magnesium, sodium, carbonates and chlorides ,it makes high percentage of the ionic composition . Usually freshwater contains higher bicarbonate ratio while seawater contains sodium and chloride concentrations. C.Biological Parameters Algae: Algae [1] are aquatic, plant-like organisms. They are also determined phytoplankton which are found floating in water to large seaweeds (micro algae) attached to ocean floor and has variety of simple structures. Algae can be found residing in oceans, lakes, rivers, ponds and even in snow, anywhere on Earth. Phytoplankton: Phytoplankton [1] are microorganisms that drift about in water. They are single-celled, and sometimes can grow large enough to be seen by the human eye. Phytoplankton are photosynthetic; it has ability to make use of sunlight to convert carbon dioxide and water into energy. Measurement levels: on the surrounding as single celled spatially distributed A WSN system provides wireless that several internal antenna or parts: an Measurement parameter Ph Turbidity Dissolved Oxygen Conductivity/Salinity Temperature TDS WHO standard (Drinking Water) 7-8.5(<=8) 1-5NTU 5-6mg/l 25C 15C 600-1000mg/l @ IJTSRD | Available Online @ www.ijtsrd.com | Volume – 2 | Issue – 1 | Nov-Dec 2017 Page: 28
International Journal of Trend in Scientific Research and Development (IJTSRD) ISSN: 2456-6470 in hospitals and at homes. Embedded devices are used to track the physical state of a person for continuous health diagnosis, using as input the data from a network of depth cameras, a sensing floor, or other similar devices. Environmental sensing: applications in monitoring environmental parameters. They share the extra challenges of harsh environments and reduced power supply. Air pollution monitoring: Deployment of wireless sensor networks in several cities; it is used to monitor the concentration of toxic gas in air. It can take advantage of the ad hoc wireless when compared to wired installations, which also make them more mobile for testing readings in different areas. Water quality monitoring: concentrate on analyzing water properties in dams, rivers, lakes and oceans, as well as underground water reserves. By using wireless distributed sensors, it enables the creation of a more accurate map of the water status, and allows the permanent deployment of monitoring stations in locations, without the need of manual data retrieval. NATURAL DISASTER wireless sensor networks are used to prevent the consequences of natural disasters, like floods. Wireless nodes are implemented successfully in rivers where changes of the water levels have to be monitored in real time. VI. BLUETOOTH VII. Uses Bluetooth is used for low-power consumption, with a small range based on cost transceiver microchips in each device. Power Consumption: There are lots of Class Max. permitted power Typ. range (m) (mW) (dBm) 100 20 ~100 1 2.5 4 ~10 2 1 0 ~1 3 0.5 -3 ~0.5 4 Version: Bluetooth version 3.0 Maximum speed Maximum Range Water monitoring 25 Mbit/s 10 meters (33 ft) 4.0 25 Mbit/s 60 meters (200 ft) 240 meters (800 ft) 5 50 Mbit/s PREVENTION: VIII.Literature Review Dr.Seema Tiwari “Water Quality Parameters-A Review”, This paper [5] describes Physiochemical parameter learning is very important to get idea about quality of water. Water has to be tested with various kinds of physiochemical parameter. Testing of water only depends on the quality and purity. Water consists of floating, dissolved, suspended and microbiological with bacteriological impurities. Physical properties includes temperature, color, odour, pH, turbidity, TDS.Chemical properties DO, alkalinity, hardness and other characters. For exchanging data over short distances, Bluetooth is a standard wireless technology wavelength UHF radio waves in the ISM band from 2.4 to 2.485 GHz) from fixed and mobile devices, and building personal area networks (PANs). It was originally conceived as a wireless alternative to RS- 232data cables. Bluetooth protocol with master/slave architecture. Devices share the master’s clock to exchange the packet and are based on the basic clock, which is defined by the master, at 312.5 µs intervals. At any given time, data can be transferred between the master and one other device (except for the little-used broadcast mode). By choosing the slave device to address, the switches from individual device to another in a round- robin fashion. (using short- Shruti Sridharan, “Water quality monitoring using wireless sensor networks”, This paper explains the traditional approach for water analysis. Take one or more samples of the water and brought these samples to the laboratory for further analysis. These conventional methods [4] have lot of limitations due to the high variability of the water physiochemical and microbiological parameters. It includes several sources of errors that affect the conventional method water monitoring. There were lot of error occurred during sample collection, data manipulation, reporting status. The development of new technologies for WQM systems came with WSN. is a packet-based @ IJTSRD | Available Online @ www.ijtsrd.com | Volume – 2 | Issue – 1 | Nov-Dec 2017 Page: 29
International Journal of Trend in Scientific Research and Development (IJTSRD) ISSN: 2456-6470 The use of WSN is particularly due to low cost of sensor nodes, ability to communicate the data using low power wireless communication techniques. Mr. Vikas Mane1, “Water Quality Measuring System Using Wireless Sensor Network”. This paper describesto measure quality of water like pH level, temperature and turbidity of drinking water and it includes water that may be used for domestic, agriculture and industrial process. It explains to measure and monitor by using sensors .The sensors were connected to analog to digital converter for producing digital input to PIC processor .LCD [8] was connected to display values and another side of processor connected to wireless module monitoring. Here solar panel used for power supply. The solar panel helps to reduce the cost of power consumption. The aim of this paper was to monitor the quality of water in power consumption with low cost. Dr.K.Karuppusamy M.E, Ph.D, B.Abinaya, R Sudha, J P ArunPrasath, ”Water Quality Monitoring and Control Using Wireless Sensor Networks”, This paper explains ,reason for efficient monitoring of quality of water in lakes, sea, rivers. It uses the different sensor for monitoring pH, DO, conductivity and temperature and the system contains PIC microcontroller and wireless module. Here wireless module was ZigBee transceiver [6].The Wireless Sensor Network based on ZigBee transceiver proposed for the purpose of low cost and high performance. The data rate of the ZigBee Transceiver is 250kbps at 2.4 GHz.ZigBee covers 10 to 20 meters. The WSN system consists of database management system for storing the required data to display and monitor the system. Chandrappa s and Dharmanna L, Shyama Srivatsa Bhatta U, V Sudeeksha Chiploonkar M, Suraksha M N and Thrupthi S”Design and Development of IoT Device to Measure Quality of Water “This paper explains development of IoT device like Raspberry pi 2[7] to measure the quality of water and send the message to the mobile phone through Way2Sms.com [7] by using the wireless module. The aim of this paper was to measure the quality of water and display the results with help mobile phone and system with low cost and very portable to use. IX. Conclusions Measuring and monitoring the quality of water is very important for human health, eco system and animals. This survey describes the various old and recent technologies and explains about water quality parameters, what are the need for monitoring and measuring the quality of water in lake, rivers, sea and drinking water. It also explains what are devices needed to measure and monitor quality of water. References 1)www.fondriest.com. 2)www.engineersgarage.com. for 3)www.ni.com. 4)Shruti Sridharan, “Water quality monitoring using wireless sensor networks”. 5)Dr.Seema Tiwari “Water Quality Parameters-A Review”. 6)Dr.K.Karuppusamy M.E, Ph.D, B.Abinaya, R Sudha, J P ArunPrasath,”Water Monitoring and Control Using Wireless Sensor Networks”. Quality 7)Chandrappa S and Dharmanna L,Shyama Srivatsa Bhatta U V,Sudeeksha Chiploonkar M,Suraksha M N and Thrupthi S”Design and Development of IoT Device to Measure Quality of Water” 8)Mr. Vikas Mane, Mr. Pranav Medsinge, Mr. Akash Chavan, Mr. Sudhakar Patil ,“Water Quality Measuring System Using Wireless Sensor Network”. @ IJTSRD | Available Online @ www.ijtsrd.com | Volume – 2 | Issue – 1 | Nov-Dec 2017 Page: 30