Download
1 / 5
50 likes | 65 Views
Data mining techniques play an important role in data analysis. For the construction of a classification model which could predict performance of students, particularly for engineering branches, a decision tree algorithm associated with the data mining techniques have been used in the research. A number of factors may affect the performance of students. Data mining technology which can relate to this student grade well and we also used classification algorithms prediction. We proposed student data classification using Naive Bayesian Classifier. Khin Khin Lay | Aung Cho "Using Naive Bayesian Classifier for Predicting Performance of a Student" Published in International Journal of Trend in Scientific Research and Development (ijtsrd), ISSN: 2456-6470, Volume-3 | Issue-5 , August 2019, URL: https://www.ijtsrd.com/papers/ijtsrd26463.pdf Paper URL: https://www.ijtsrd.com/computer-science/data-miining/26463/using-naive-bayesian-classifier-for-predicting-performance-of-a-student/khin-khin-lay<br>

E N D
International Journal of Trend in Scientific Research and Development (IJTSRD) Volume 3 Issue 5, August 2019 Available Online: www.ijtsrd.com e-ISSN: 2456 – 6470 Using Naive Bayesian Classifier for Predicting Performance of a Student Khin Khin Lay, Aung Cho University of Computer Studies, Maubin, Myanmar How to cite this paper: Khin Khin Lay | Aung Cho "Using Naive Bayesian Classifier for Predicting Performance of a Student" Published in International Journal of Trend in Scientific Research and Development (ijtsrd), ISSN: 2456- 6470, Volume-3 | Issue-5, August 2019, https://doi.org/10.31142/ijtsrd26463 Copyright © 2019 by author(s) and International Journal of Trend in Scientific Research and Development Journal. This is an Open Access article distributed under the terms of the Creative Commons Attribution License (CC (http://creativecommons.org/licenses/by /4.0) There are increasing research interests in using data mining in education. This new emerging field, called Educational Data Mining, concerns with developing methods that discover knowledge from data originating from educational environments [4]. Educational Data Mining uses many techniques such as Decision Trees, Neural Networks, Naïve Bays, K- Nearest neighbor, and many others. The main aim of this paper is to use data mining methodologies to study students’ performance in the courses. Data mining provides many tasks that could be used to study the student performance. Here the classification tasks is used to evaluate student’s performance and as there are many approaches that are used for data classification, the decision tree and Naive Bays method are used [4]. Decision trees can easily be converted to classification rules Decision tree algorithms, such as ID3 (Iterative Dichotomies), C4.5, and CART (Classification and Regression Trees) [3]. Naïve Bayesian classifiers assume that the effect of an attribute value on a given class is independent of the values of the other attribute [3].This paper explores the accuracy of Decision tree and Naive Bays techniques for predicting student performance. II. RELATED WORK In order to predict the performance of students the searcher took into consideration the work of other 14 ADecision Tree Approach forPredicting Students Academic Performance researchers that are in the same direction. Other researchers have looked at the work of predicting students’ performance ABSTRACT Data mining techniques play an important role in data analysis. For the construction of a classification model which could predict performance of students, particularly for engineering branches, a decision tree algorithm associated with the data mining techniques have been used in the research. A number of factors may affect the performance of students. Data mining technology which can relate to this student grade well and we also used classification algorithms prediction. We proposed student data classification using Naive Bayesian Classifier. KEYWORDS: Classification, Naive Bayesian, Data Mining, Predicting Performance I. INTRODUCTION Data Mining Advancement in technology has brought great growth in the volume of the data available on the internet, digital libraries, news sources and company-wide intranets. This makes a huge number of databases and information repositories available, but it is impossible to manually organize, analyze and retrieve information from this data. This generates an eminent need of methods that can help users to efficiently navigate, summarize, and organize the data so that it can further be used for applications ranging from market analysis, fraud detection and customer retention etc. Therefore, the techniques that perform data analysis and may uncover important data patterns are needed. One of these techniques is known as data mining. by applying many approaches and coming up with diverse results. Classification is a classic data mining technique based on machine learning. Basically classification is used to classify Each item in a set of data into one of predefined set of classes or groups. Classification method makes use of mathematical Techniques such as decision trees, linear programming, neural network and statistics. In classification, once the software is made that can learn how to classify the data items into groups. Three supervised data mining algorithms, i.e. Bayesian, Decision trees and Neural Networks which were applied by [1] on the preoperative assessment data to predict success in a course (to produce result as either passed or failed) and the performance of the learning methods were evaluated based on their predictive accuracy, ease of learning and user friendly characteristics. The researchers observed that that this methodology can be used to help students and teachers to improve student’s performance; reduce failing ratio by taking appropriate steps at right time to improve the quality of learning. The authors in [9] analyzed student’s performance data using classification algorithm named ID3 to predict student’s marks at the end of the semester. This was applied for master of computer applications course from 2007 to 2010 in VBS Purvanchal University, Jaunpur. Their study aimed to help students and teachers find ways to improve students’ IJTSRD26463 pp.1387-1391, BY 4.0) @ IJTSRD | Unique Paper ID – IJTSRD26463 | Volume – 3 | Issue – 5 | July - August 2019 Page 1387
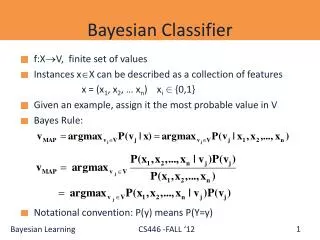
International Journal of Trend in Scientific Research and Development (IJTSRD) @ www.ijtsrd.com eISSN: 2456-6470 performance. Data was collected from 50 students, and then a set of rules was extracted for their analysis. Another study that focused on the behavior to improve students' performance using data mining techniques is illustrated in [10]. The data consisted of 151 instances from a data base management system course held at the Islamic University of Gaza. The data was collected from personal records and academic records of students. The author performed the data mining techniques, namely: association rules, classification, and clustering and outlier detection. The results revealed useful information from association rules and classification models. III. OUR PROPOSED METHOD a.Naïve Bayesian Classifier Student performance is predicted using a data mining technique called classification rules. The naïve Bayes classification algorithm is used by the administrator to predict student performance based on performance detail. The algorithm is a simple probabilistic classifier that calculates a set of probabilities by counting the frequency and combinations of values in a given dataset. The algorithm uses the Bayes theorem and assumes that all attributes are independent given the value of the class variable. This conditional independence assumption rarely holds true in real-world applications, hence the characterization as naïve. However, the algorithm tends to perform well and learn rapidly in various supervised classification problems [11]. The naïve Bayesian classifier works as follows: 1. We let T be a training set of samples, each with their class labels. k classes, C1,C2, . . . ,Ck exist. Each sample is represented by an n-dimensional vector, X = {x1, x2, . . . , xn} that depicts n measured values of the n attributes, A1,A2, . .. , An, respectively. 2. Given a sample X, the classifier will predict that X belongs to the class having the highest a posteriori probability, Conditioned on X. X is predicted to belong to the class Ci if and only if P(Ci|X) > P(Cj |X) for 1<= j <= m, j ≠i. Thus, we find the class that maximizes P(Ci|X). The class Ci for which P(Ci|X) is maximized is called the maximum posteriori hypothesis. By Bayes’ theorem, P(Ci|X) = P(X|Ci) P(Ci) P(X) 3. Given that P(X) is the same for all classes, only P(X|Ci)P(Ci) needs to be maximized. If the class a priori probabilities, P(Ci), are not known, then we assume that the classes are equally likely, that is, P(C1) = P(C2) = . . . = P(Ck), and we would therefore maximize P(X|Ci). Otherwise, we maximize P(X|Ci)P(Ci). The class a priori probabilities may be estimated by P(Ci) = freq(Ci, T)/|T|. 4. Given data sets with many attributes, computing P(X|Ci) would be computationally expensive. To reduce computation in evaluating P(X|Ci)P(Ci), the naïve assumption of class conditional independence is made. This assumption presumes that the values of the attributes are conditionally independent of one another, given the class label of the sample. P (X Ci ) ≈ ∏ ?=1(Xk Ci) Eq(1.1) ? ? The probabilities P(x1|Ci), P(x2|Ci), . . . , P(xn|Ci) can easily be estimated from the training set. Here, xk refers to the value of attribute Ak for sample X. 5. To predict the class label of X, P(X|Ci)P(Ci) is evaluated for each class Ci. The classifier predicts that the class label of X is Ci if and only if it is the class that maximizes P(X|Ci)P(Ci) [12]. IV. Training Dataset The first step in this paper is to collect data. It is important to select the most suitable attributes which influence the student performance. We have training set of 30 under graduate students.We were provided with a training dataset consisting of information about students admitted to the first year in Table I. TABLE.I Training dataset Sr. no. Roll no. Attend-ance Apti- tude Assign-ment Test Present-ation 1 IT1 Good Avg 2 IT2 Good Avg 3 IT 3 Good Avg 4 IT4 Good Avg 5 IT5 Good Avg 6 IT6 Avg Avg 7 IT7 Poor Good 8 IT8 Avg Good 9 IT9 Avg Good 10 IT10 Poor Poor 11 IT11 Poor Poor 12 IT12 Avg Age 13 IT13 Good Good 14 IT14 Good Good 15 IT15 Good Good 16 IT16 Good Good 17 IT17 Good Avg 18 IT18 Good Avg 19 IT19 Good Avg 20 IT20 Good Poor Grade Excellent Excellent Excellent Excellent Excellent Good Good Good Good Fail Fail Excellent Excellent Excellent Excellent Excellent Excellent Excellent Excellent Excellent Yes Yes Yes Yes Yes Yes Yes Yes Yes No No Yes Yes Yes Yes Yes Yes Yes Yes Yes Pass Pass Pass Pass Pass Pass Pass Pass Pass Fail Fail Pass Pass Pass Pass Pass Pass Pass Pass Pass Good Good Good Good Good Avg Avg Avg Avg Poor Poor Age Good Good Good Good Good Good Good Good @ IJTSRD | Unique Paper ID – IJTSRD26463 | Volume – 3 | Issue – 5 | July - August 2019 Page 1388
International Journal of Trend in Scientific Research and Development (IJTSRD) @ www.ijtsrd.com eISSN: 2456-6470 21 22 23 24 25 26 27 28 29 30 IT21 IT22 IT23 IT24 IT25 IT26 IT27 IT28 IT29 IT30 Good Good Good Good Poor Avg Poor Good Good Good Poor Poor Poor Poor Poor Good Good Good Good Good Yes Yes Yes Yes No Yes No Yes Yes Yes Pass Pass Pass Pass Fail Pass Fail Pass Pass Pass Good Good Good Good Poor Avg Poor Good Good Good Excellent Excellent Excellent Excellent Fail Good Fail Excellent Excellent Excellent A. Classification Steps TABLE.II Frequency Tables Grade Frequency Table Excellent Good Fail 20 1 0 Good Average Poor 0 4 1 0 0 4 Attendance Grade Frequency Table Excellent Good Fail 7 9 5 Good Average Poor 4 1 0 1 0 3 Aptitude Grade Frequency Table Excellent Good Fail 21 0 Yes No 5 0 0 4 Assignment Grade Frequency Table Excellent Good Fail 20 0 Pass Fail 5 0 0 4 Test Grade Frequency Table Excellent Good Fail 20 1 0 Good Average Poor 0 5 0 0 0 4 Presentation TABLE.III Likelihood Tables Grade Likelihood Table Excellent Good 20/21 1/21 0/21 21/30 Fail 0/4 0/4 4/4 4/30 Good Average Poor 0/5 4/5 1/5 5/30 20/30 5/30 5/30 Attendance Grade Likelihood Table Excellent Good 7/21 9/21 5/21 21/30 Fail 1/4 0/4 3/4 4/30 Good Average Poor 4/5 1/5 0/5 5/30 12/30 10/30 8/30 Aptitude Grade Likelihood Table Excellent Good 21/21 0/21 21/30 Fail 0/4 4/4 4/30 Yes No 5/5 0/5 5/30 26/30 4/30 Assignment @ IJTSRD | Unique Paper ID – IJTSRD26463 | Volume – 3 | Issue – 5 | July - August 2019 Page 1389
International Journal of Trend in Scientific Research and Development (IJTSRD) @ www.ijtsrd.com eISSN: 2456-6470 Grade Likelihood Table Excellent Good 21/21 0/21 21/30 Fail 0/4 Pass 5/5 26/30 Test Fail 0/5 4/4 4/30 5/30 4/30 Grade Good 0/5 5/5 0/5 5/30 Likelihood Table Excellent 20/21 1/21 0/21 21/30 Fail 0/4 0/4 4/4 4/30 Good Avg Poor 20/30 6/30 4/30 Presentation We computed all possible individual probabilities conditioned on the target attribute (Grade) in Table IV. TABLE IV Possible Probabilities P(Grade=Excellent) P(Atten=GoodGrade=Ex) P(Atten=AvgGrade=Ex) P(Atten=PoorGrade=Ex) P(Aptitu=GoodGrade=Ex) P(Aptitu=AvgGrade=Ex) P(Aptitu=PoorGrade=Ex) P(Assig=YesGrade=Ex) P(Assig=NoGrade=Ex) P(Test=PassGrade=Ex) P(Test=FailGrade=Ex) P(Present=GoodGrade=Ex) P(Present =AvgGrade=Ex) P(Present =PoorGrade=Ex) P(Grade=Good) P(Atten=GoodGrade=G) P(Atten=AvgGrade=G) P(Atten=PoorGrade=G) P(Aptitu=GoodGrade=G) P(Aptitu=AvgGrade=G) P(Aptitu=PoorGrade=G) P(Assig=YesGrade=G) P(Assig=NoGrade=G) P(Test=PassGrade=G) P(Test=FailGrade=G) P(Present=GoodGrade=G) P(Present =AvgGrade=G) P(Present =PoorGrade=G) 0 P(Grade=Fail) P(Atten=GoodGrade=Fail) P(Atten=AvgGrade=Fail) P(Atten=PoorGrade=Fail) P(Aptitu=GoodGrade=Fail) P(Aptitu=AvgGrade=Fail) P(Aptitu=PoorGrade=Fail) P(Assig=YesGrade=Fail) P(Assig=NoGrade=Fail) P(Test=PassGrade=Fail) P(Test=FailGrade=Fail) P(Present=GoodGrade=Fail) P(Present =AvgGrade=Fail) P(Present =PoorGrade=Fail) 21/30=0.7 0.9523 0.0476 0 0.3333 0.4286 0.2381 1 0 1 0 0.9523 0.0476 0 5/30=0.1667 0 0.8 0.2 0.8 0.2 0 1 0 1 0 0 1 4/30=0.133 0 0 1 0.25 0 0.75 0 1 0 1 0 0 1 @ IJTSRD | Unique Paper ID – IJTSRD26463 | Volume – 3 | Issue – 5 | July - August 2019 Page 1390
International Journal of Trend in Scientific Research and Development (IJTSRD) @ www.ijtsrd.com eISSN: 2456-6470 b.Testing Data Sr.no. Roll no. Attend-ance Apti- tude Assign-ment Test Presentation Grade 1 IT1 Good Avg 2 IT27 Poor Good Yes No Pass Fail Good Poor ? ? Likelihood of “Excellent” on that IT1 = P (Atten=GoodGrade=Ex) * P(Aptitu=AvgGrade=Ex)* P (Assig=YesGrade=Ex) * P(Test=PassGrade=Ex) * P (Present=GoodGrade=Ex) * P(Grade=Excellent) = 0.9523* 0.4286*1*1* 0.9523* 0.7 = 0.27208 Similarly Likelihood of “Good” on that IT1 =0 Similarly Likelihood of “Fail” on that IT1 =0 Similarly Likelihood of “Excellent” on that IT27 =0 SimilarlyLikelihood of “Good” on that IT27 =0 Likelihood of “Fail” on that IT27 = P (Atten=PoorGrade=Fail) * P(Aptitu=GoodGrade=Fail) * P (Assig=NoGrade=Fail) * P(Test=FailGrade=Fail) * P(Present =PoorGrade=Fail * P(Grade=Fail) = 1 * 0.25 * 1 * 1* 1* 0.133 = 0.03325 Probability of IT1 being Grade = “Excellent” is 0.27208 Which is greater than another probability? Hence, IT1 will be Grade to Excellent. Probability of IT27 being Grade =” Fail” is 0.03325which is greater than another probability. Hence, IT27 will be Grade to Fail. V. CONCLUSION A classification model has been proposed in this study for predicting student’s grades particularly for IT under graduate students. In this paper, the classification task is used on student database to predict the students division on the basis of previous database. As there are many approaches that are used for data classification, Naive Bayesian classifiers method is used here. Information’s like Attendance, aptitude, test, Presentation and Assignment marks were collected from the student’s previous database, to predict the performance at the end of the semester. Bayes classifier algorithms are used in this model and the accuracy of prediction is compared to find the optimal one. Finally, the naïve Bayes algorithm is selected as the best algorithm for prediction based on performance detail. REFERENCES [1] Osmanbegovic E., Suljic M. “Data mining approach for predicting student performance” Economic Review- Journal of Economics and Business. Volume 10(1) (2012) [2]Behrouz, M, Karshy, D, Korlemeyer G, Punch, W. “Predicting student performance: an application of data Mining methods with the educational web-based system” Lon-capa. 33rd ASEE/IEEE Frontiers in Education Conference. Boulder C.O. USA, (2003). [3]Bekele, R., Menzel, W. “A bayesian approach to predict performance of a student (BAPPS): A Case with Ethiopian Students”. Journal of Information Science (2013). [4]Han and M. Kamber, “Data Mining: Concepts and Techniques,Morgan Kaufmann, 2000 [5][5] Surjeet K, Yadav, Bharadwaj, B. Pal B.” Data Minig Applications: A comparative Study for Predicting Student’s performance.” International journal of innovative technology & creative engineering. Volume 1(12). (2012). [6]Nnamani, C. N, Dikko, H. G and Kinta, L. M. “Impact of students‟ financial strength on their academic performance: Kaduna Polytechnic experience”. African Research Review 8(1), (2014). [7]Ogunde A.O., Ajibade D.A. “A data Mining System for Predicting University Students F=Graduation Grade Using ID3 Decision Tree approach”, Journal of Computer Science and Information Technology, Volume 2(1) (2014). [8]Undavia, J. N., Dolia, P. M.; Shah, N. P. “Prediction of Graduate Students for Master Degree based on Their Past Performance using Decision Tree in Weka Environment”. International Journal of Computer Applications; Volume https://www.wekatutorial.com/ 74 (21), (2013). [9]B. K. Baradwaj and S. Pal, "Mining educational data to analyze students' performance " International Journal of Advanced Computer Science and Applications, vol. 2, 2011. [10]A. El-Halees, "Mining student data to analyze learning behavior: A case study," presented at the International Arab Conference of (ACIT2008), Tunisia, 2008. Information Technology [11]George Dimitoglou, James A. Adams, and Carol M. Jim,” Comparison of the C4.5 and a Naïve Bayes Classifier for the Prediction of Lung Cancer Survivability”, Journal of Computing, Volume 4, Issue 8, 2012. [12]Leung, K. Ming. “Naïve Bayesian classifier.” Polytechnic University Department of Computer Science/Finance and Risk Engineering (2007). @ IJTSRD | Unique Paper ID – IJTSRD26463 | Volume – 3 | Issue – 5 | July - August 2019 Page 1391