Download
1 / 6
60 likes | 79 Views
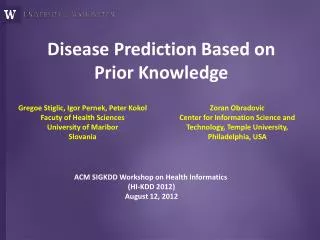
Previous research shows strong evidence that traditional regression based predictive models face significant challenges in predictability tests due to uncertain models and unstable parameters. Recent studies introduce new, stable strategies to overcome these problems. Support Vector Clustering is a relatively new learning algorithm that has the desirable characteristics of the control of the decision function, the use of the kernel method, and the sparsity of the solution. In this paper, we present a theoretical and empirical framework to apply the Support Vector Machines strategy to predict the stock market. There are many factors like macro and microeconomic events that may influence the stock trend. For predicting the stock performance, Support Vector Machine is used to analyze the relationship between these factors. Our results suggest that support vector clustering is a powerful predictive tool for stock predictions in the financial market. G. Saminath Krisna | Dr. R. Indra Gandhi "Stock Prediction System Based on Key Statistics for S&P 500 With Linear SVC" Published in International Journal of Trend in Scientific Research and Development (ijtsrd), ISSN: 2456-6470, Volume-2 | Issue-3 , April 2018, URL: https://www.ijtsrd.com/papers/ijtsrd11170.pdf Paper URL: http://www.ijtsrd.com/economics/market-economy/11170/stock-prediction-system-based-on-key-statistics-for-sandp-500-with-linear-svc/g-saminath-krisna<br>

E N D
International Research Research and Development (IJTSRD) International Open Access Journal Stock Prediction System Based on Key Statistics for S&P 500 With Linear SVC G. Saminath Krisna, Dr. R. Indra Gandhi Department of Computer Science, GKM College of Engineering and Technology, Chennai, Tamil Nadu, India International Journal of Trend in Scientific Scientific (IJTSRD) International Open Access Journal ISSN No: 2456 ISSN No: 2456 - 6470 | www.ijtsrd.com | Volume 6470 | www.ijtsrd.com | Volume - 2 | Issue – 3 Stock Prediction System Based on Key Statistics Stock Prediction System Based on Key Statistics for S&P 500 With Linear SVC G. Saminath Krisna Department of Computer Science of Engineering and Technology ABSTRACT Previous research shows strong evidence that traditional regression- based predictive models significant challenges in predictability tests due to uncertain models and unstable parameters. Recent studies introduce new, stable strategies to overcome these problems. Support Vector Clustering is a relatively new learning algorithm that has the desirable characteristics of the control of the decision function, the use of the kernel method, and the sparsity of the solution. In this paper, we present a theoretical and empirical framework to apply Support Vector Machines strategy to predict the stock market. There are many factors like microeconomic events that may influence the stock trend. For predicting the stock performance, Support Vector Machine is used to analyze the relationship between these factors. Our results suggest that support vector clustering is a powerful predictive tool for stock predictions in the financial market. Keywords: Stock prediction, predictive models, predictive algorithms and training data INTRODUCTION Previous research shows strong evidence that based predictive models face challenges in predictability tests due to combine prior knowledge of financial market with observable information into trading strategies. an accurately predict the fluctuation of stock price bring huge underlying income for fund managers and financial investors. combine prior knowledge of financial market with non-observable information into trading These algorithms can accurately predict the fluctuation of stock price bring huge income for fund managers and financial investors. Machine learning algorithms able to form the basis for effective stock price prediction and trading quantitative trading algorithms using machine learning and data mining technologies have been raising much interest these years. Consequently, a wide range of new insights and opportunities are provided for the traders to combine prior knowled of finance with non-observable information. observable information. parameters. Recent studies introduce new, stable strategies to overcome Support Vector Clustering is a relatively new learning algorithm that has the ristics of the control of the decision function, the use of the kernel method, and the sparsity of the solution. In this paper, we present a theoretical and empirical framework to apply the Support Vector Machines strategy to predict the stock e are many factors like macro and microeconomic events that may influence the stock leveraging big data are able to form the basis for effective stock price decisio decision making, so quantitative trading algorithms using machine technologies have been raising much interest these years. Consequently, a insights and opportunities are provided for the traders to combine prior knowledge performance, Support REVIEW OF LITERATURE REVIEW OF LITERATURE Vector Machine is used to analyze the relationship factors. Our results suggest that support ering is a powerful predictive tool for predictions in the financial market. The review of various works brings out various interesting facts. There are several studies that data mining and analysis tools to investigate the predictability of various financial predictability of various financial series. The review of various works brings out various interesting facts. There are several studies that apply data mining and analysis tools to investigate the Stock prediction, predictive models, The reasons quoted for applying data mining tools are its ability to handle voluminous data and nontrivial extraction of implicit, previously unknown, and potentially useful information from financial data. The literature review point out the fact that results of among different financial markets. The other interesting fact is that data mining tools are to consistently outperform other statistical approaches. The literature suggests that data mining The reasons quoted for applying data mining tools are its ability to handle voluminous data extraction of implicit, previously unknown, and potentially useful information The literature review point out the fact prediction varies among different financial markets. The other interesting fact is that data mining tools are found to consistently outperform other statistical approaches. The literature suggests that data tools are likely to predict stock market price movements better when compared to other The most obvious advantage of the data mining techniques is that they can outperform the classical Quantitative trading using artificial intelligence and machine learning algorithms is raising recently. Machine learning algorithms leveraging Big Data and novel hardware can form the basis for effective stock price movement reasoning and artificial intelligent trading decision making. Machine learning algorithms are becoming better at various tasks from manual to cognition. This gives traders a wide range of new insights and opportunities to wide range of new insights and opportunities to Quantitative trading using artificial intelligence and much interest recently. Machine learning algorithms leveraging Big can form the basis for effective stock price movement reasoning and decision making. Machine s are becoming better at various manual to cognition. This gives traders a ct stock market price movements better when compared to other methods. . The most obvious advantage of the data mining outperform the classical @ IJTSRD | Available Online @ www.ijtsrd.com @ IJTSRD | Available Online @ www.ijtsrd.com | Volume – 2 | Issue – 3 | Mar-Apr 2018 Apr 2018 Page: 972
International Journal of Trend in Scientific Research and Development (IJTSRD) ISSN: 2456-6470 statistical methods with 520% higher accuracy rate. Majority of the studies incorporated technical factors, intraday movements and macro-economic indicators as input factors for predicting the stock price movements. However, not many studies are concerned with including the global cues and its influence on predicting the stock index movements. Higher evolutionary computing tools like Random Forest and SVM, increased the efficiency of prediction from KNN and ANN with use of. About 60% of the articles used feed forward neural networks and recurrent networks. The literature review highlights that both statistical and nonstatistical measures were used to evaluate the efficiency of the data mining approaches adopted by researchers. The review of previous works showed that the earlier works undertaken are highly empirical and it is inferred that new research works in new markets at different time periods are likely to show new results and insights. The review also points out that not many studies have been undertaken in Indian and other emerging market economies. Also a comprehensive comparative analysis of the above markets is not undertaken using a data mining approach. The selection of tools initially started from ANN, and moved to Support Vector machines. The SVC (Support Vector Clustering) method was not used for prediction of stock market trend in many studies. Hence an attempt to use successful SVC and other data mining tools to evaluate the predictability of financial markets. MAJOR STAGES 1) Data Acquisition 2) Feature extraction 3) Getting current data 4) Prediction Stock prediction is one of the important applications of machine learning that has elevated in recent years. Stock prediction process depends upon number of factors like economic factors, rumours, investors sentiments, management statistics, etc and these factors influence the movement of stock price. There are four different phases in a stock prediction system, namely: Data acquisition, feature extraction, getting current data and prediction. quality fundamental DATA ACQUISITION Data acquisition is the first stage is the stock prediction system. The data can be acquired either by parsing a stock quote website or by using a data providing service like quandl. The data acquired by parsing websites are stored as html files in the system and os walk is used to acquires the data within the web pages. The webpages are then analysed to find the required data. The acquired data is then stored in a csv (comma separated value) file. If the data is acquired from data providers like Quandl or Bloomberg then, the data comes by default in the csv format. So if you are using data providers to get your data, then data acquisition becomes much easier. Parsing data from websites There are many frameworks and libraries available for parsing websites. Read the documentation of the website carefully before parsing it. Some websites do not allow developers to parse the websites without permission. The most common library for python to parse websites is beautiful-soup-4. There are also many other good libraries available for python which makes it easy to parse websites. The parsed websites can be stored in the system based on the system based on the ticker symbol and date. @ IJTSRD | Available Online @ www.ijtsrd.com | Volume – 2 | Issue – 3 | Mar-Apr 2018 Page: 973
International Journal of Trend in Scientific Research and Development (IJTSRD) ISSN: 2456-6470 Data providers are corporations which sell data in exchange for money. There are lot of companies that sell data with different subscription models. Some of the well known websites for getting data are Quandl and bloomberg. The OHLC data can be acquired for free from many websites. But for this project we need the fundamental statistics of all the companies in s&p 500. For that we have to subscribe to any of the above mentioned data providers. They also have API (Application Programming Interface) and JSON (Javascript Object Notation) modes to get data other than CSV (Comma Separated Values). FEATURE EXTRACTION Munging is the process of clearing out the redundant information from the obtained data. If the data is obtained by parsing websites, then this process becomes much more complicated. The data obtained from data providers are usually pre processed and the redundant data is removed at the source. The important features are extracted in this stage. If we are using an API for getting data from the data provider, then we can specifically get the required data. The parsed data should also be stored in the csv or table format to process it using pandas. The pandas library @ IJTSRD | Available Online @ www.ijtsrd.com | Volume – 2 | Issue – 3 | Mar-Apr 2018 Page: 974
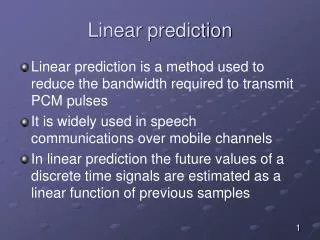
International Journal of Trend in Scientific Research and Development (IJTSRD) ISSN: 2456-6470 converts the csv file into a dataframe and the dataframe is used for further processing. SVC is a supervised form of learning. So the data has to be labeled as either outperforming or underperforming. GETTING CURRENT DATA SUPPORT VECTOR MACHINES The current data can either be acquired using parsing yahoo finance or from a data provider. If you are subscribed to a data provider, they can provide you with daily OHLC prices and quarterly key statistics. If you are using web parsing to get the data, you should parse the website once every 3 months, and update your stock list. Data providers update their technical data on a daily basis, with quarterly release of fundamental data. SVM is a supervised machine learning model with associated learning algorithms that are used for analyzing and predicting probabilities, using the given data. It used to perform classification and regression analysis on the given structured and unstructured data. SVM is a non-probabilistic linear classifier. Given a labeled set of training examples, each marked as belonging to one or the other. The SVM training algorithm builds a model that assigns new examples to one category or the other. It is a representation of the examples as points in space, mapped so that the data points are separated clearly. Additional new data plots are then incorporated into that same space. Based on where the point falls on, it is added to specific categories. Support Vector Machines can also perform non linear classification using the kernel trick. @ IJTSRD | Available Online @ www.ijtsrd.com | Volume – 2 | Issue – 3 | Mar-Apr 2018 Page: 975
International Journal of Trend in Scientific Research and Development (IJTSRD) ISSN: 2456-6470 In SVC data points are mapped from data space to a high dimensional feature space using the kernel function. In feature space we look for the smallest sphere that encloses the image of the data points using the Support vector domain description algorithm (DDA). This sphere, when mapped back into the data space, will form a set of contours which can enclose the data points. We interpret these contours as cluster boundaries, and points enclosed by each contour are associated by support vector clustering to the same cluster. SUPPORT VECTOR CLUSTERING Clustering is to partition a data set into different groups according to some criterion in an attempt to organize data into a more meaningful form. There are many ways of achieving this form. Clustering may proceed according to some parametric model or by grouping data points according to some distance or similarity measure as in hierarchical clustering. It usually adds cluster boundaries within regions of the data space where there is insufficient data in the probability distribution area. This is the path taken in support vector clustering, which is based on the support vector approach. The accuracy of prediction and the percentage gain of the predicted stock compared to the benchmark can be interpreted. PREDICTION The multidimensional and multivariate data is then structured and passed to the prediction model. Linear Support Vector Clustering algorithm is used for predicting the future price of the stock. We can also compare the predicted stock’s performance with the s&p 500 benchmark. @ IJTSRD | Available Online @ www.ijtsrd.com | Volume – 2 | Issue – 3 | Mar-Apr 2018 Page: 976
International Journal of Trend in Scientific Research and Development (IJTSRD) ISSN: 2456-6470 CONCLUSION machines. The Journal of Machine Learning Research, 2:265–292, 2002. This paper proposes a SVM-based stock market trend prediction system based on the fundamental statistics and stock prices to predict the long term movement of the stock. The system takes into account a good feature subset, which contains features that are highly correlated with the output, yet uncorrelated with each other. The selected features are evaluated carefully and prioritized. The feature selection and feature evaluation are filtered by correlation-based SVM. It reduces dimension and noise of financial data as well as provides pre selected stocks for experts and investors to make a investing decision. In the proposed system, the setting of parameters have a critical impact on the performance of the resulting system. We need to investigate to develop a structured method of selecting an optimal value for the parameters in the proposed prediction system for the best results. 3.K. M. Cremers and A. Petajisto. How active is your fund manager? a new measure that predicts performance. Review of Financial Studies, 22(9):3329–3365, 2009. 4.C.-M. Hsu. A hybrid procedure for stock price prediction by integrating self-organizing map and genetic programming. Expert Systems with Applications, 38 (11):14026–14036, 2011 5.S. Gould. Learning weighted lower linear envelope potentials in binary markov random fields. IEEE transactions on pattern analysis and machine intelligence, 37(7):1336–1346, 2015. 6.W. Huang, Y. Nakamori, and S.-Y. Wang, “Forecasting stock market movement direction with support vector machine,” Computers and Operations Research, vol. 32, pp. 2513–2522, 2005. REFERENCES 7.J. D. Piotroski, “Value investing: The use of historical financial statement information to separate winners from losers,” Journal of Accounting Research, vol. 38, pp. 1–41, 2000. 1.Y. Boykov, O. Veksler, and R. Zabih. Fast approximate energy minimization via graph cuts. In Proc. of the International Conference on Computer Vision (ICCV),1999. 2.K. Crammer and Y. Singer. On the algorithmic implementation of multiclass kernel-based vector @ IJTSRD | Available Online @ www.ijtsrd.com | Volume – 2 | Issue – 3 | Mar-Apr 2018 Page: 977