Download
1 / 7
70 likes | 90 Views
The aim of this research to evaluate that whether the perception of the public differs according to the demographic variables on the factors that Affecting Turkish Public Administrators Manager Choice. Quantitative research method was used in the research and the data obtained from the survey method were analyzed with SPSS software. According to the results of the research the perception of the public on the factors that Turkish Public Administrators Manager Choice varies according to the demographic characteristics. Akin Erdemir | Ramazan Erdem "Public Perception on the Factors that Affecting Turkish Public Administrators' Manager Choice" Published in International Journal of Trend in Scientific Research and Development (ijtsrd), ISSN: 2456-6470, Volume-3 | Issue-2 , February 2019, URL: https://www.ijtsrd.com/papers/ijtsrd21508.pdf Paper URL: https://www.ijtsrd.com/management/public-sector-management/21508/public-perception-on-the-factors-that-affecting-turkish-public-administrators-manager-choice/akin-erdemir<br>

E N D
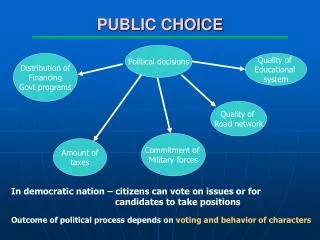
International Journal of Trend in Scientific Research and Development (IJTSRD) Volume: 3 | Issue: 2 | Jan-Feb 2019 Available Online: www.ijtsrd.com e-ISSN: 2456 - 6470 Public Perception on the Factors that Affecting Turkish Public Administrators' Manager Choice Akın Erdemir1, Ramazan Erdem2 1Süleyman Demirel University, Research and Application Hospital, Isparta, Turkey 2Süleyman Demirel University, Faculty of Economics and Administrative Sciences, Isparta, Turkey ABSTRACT The aim of this research to evaluate that whether the perception of the public differs according to the demographic variables on the factors that Affecting Turkish Public Administrators' Manager Choice. Quantitative research method was used in the research and the data obtained from the survey method were analyzed with SPSS software. According to the results of the research the perception of the public on the factors that Turkish Public Administrators' Manager Choice varies according to the demographic characteristics. Keywords: Meritocracy, leadership, team, group, member selection, building team 1.INTRODUCTION Organizations are divided into three groups in Turkey. These; private, public and non-governmental organizations (NGO). While the administrators of private and third sector organizations can select their members of the management teams, which they will work with, until 2011; administrators in public institutions and organizations had no right to choose their own management team. Turkish public administrators are given the right to choose members of their management team in accordance with the merit principle, with the latest legal arrangements1, as in private and third sector organizations. Because, the merit of administrator) is essential in terms of managerial function and contributions to achieve the organizational goals [1]. Zaccaro and Banks also stated that the merit of the preferred administrators consists of experience, knowledge, skills and social roles [2]. According to Shirazi and Mortazavi, the merit of the preferred administrators should be included in the evaluation process in order to realize the goals of the organizations [3]. The search for merit in business managers is an important factor for organizational success [4-5]. Mooney also mentioned that merit brings a competitive advantage to the organization by affecting the performance of the organization [6]. Today's conditions, as in the other two sectors, have made it mandatory for administrators in the public sector to adopt principles of merit, such as participation, transparency and accountability, fairness and consistency, and governing structures having corporate confidence [7]. It is an indisputable fact that public administrators, who are chosen according to the criteria of similarity (such as nepotism, chronism, patronage and clientelism)2 or dissimilarity (with various separatist tendencies), are not selected in accordance with the meritocracy3 principles, will cause the public to be deprived of the advantages of competent managers. If the public perception determined in this research is accepted correctly; it will be possible to say that the authority to select managers given to the public administrators is not used in accordance with its purpose, and triggers the political staffing and teaming, communitarianism and parallel state organizations4. These anti-meritocracy behaviors coincide with the types of favoritism in the literature. According to Bozkurt et al., favoritism is that people who have public facilities, behave in a way that will provide employment opportunity or financial benefits to people who are close to them by kinship or political views or other special reasons [11]. Commonly known types of favoritism are; nepotism, chronism, patronage, service nepotism, logrolling, and lobbying and privileging [12]. The main objective of the research is whether the public perception about the factors affecting Turkish public administrators' manager choice has changed according to the demographic characteristics of the public. The sub- objective of the study is to make a contribution to this field in Turkey in order to reduce the lack of relevant literature. 1.1.Assumptions It is assumed that the participants' answers to the survey used as data collection tools reflect the real situation. 1.2.Limitations This research is limited to eighteen (18) and older individuals living in the center of Isparta in July and August 2017 and capable of responding to the survey developed for this research. Since the results of the survey reflect the characteristics of this population, these limitations should be power [9]. Clientalism is to share public opportunities with the surrounding acquaintances [9]. 3According to Argon and Eren, the meritocracy is the organizational structure in which there is a merit-based system in Human Resources Management [8]. 4The concept of parallel organizations was used for the first time by Robert O. Paxton, an American political scientist and historian, in the history department of Columbia University [10]. 1Decree Law No. 652, effectuated on 14.09.2011 at the Ministry of Education and Decree Law No. 663, effectuated on 02.11.2011 in the Ministry of Health. 2According to İlhan and Erdem, Nepotism is the employment of a person to a position based on only kinship relations [8]. Chronism is the appointment of a person to the task because of relationships such as fellowship, friendship, and citizenship [8]. Patronage can be defined as, the dismissal of all the senior executives in the public sector and making new appointments to replace them, by a new party that came to @ IJTSRD | Unique Reference Paper ID – IJTSRD21508 | Volume – 3 | Issue – 2 | Jan-Feb 2019 Page: 833
International Journal of Trend in Scientific Research and Development (IJTSRD) @ www.ijtsrd.com eISSN: 2456-6470 taken into account when a generalization is to be made according to the results of the survey. Working on larger and different samples is necessary, in order to generalize the research in other provinces or countries. the Skewness and Kurtosis values were calculated. Because of the Skewness (-0.707) and Kurtosis (-1.209) values of the Trust and Loyalty Dimension was in the range of -1.96 to +1.96, this dimension was accepted as displaying a normal (parametric) distribution [14-15]. In this respect, parametric tests were used in comparison of demographic variables of this dimension. In the comparison of dual groups, the significance test (t test) of the difference between the two means and in the comparison of the three or more groups the variance analysis (ANOVA/F test) from the parametric tests was used. When a difference determined between the groups in the variance analysis, Tukey’s-b test was used to determine the source of the difference. It was concluded that the remaining six dimensions of the study did not show a normal distribution due to the Skewness and Kurtosis values, which were not in the range between -1.96 and 1.96 and thus did not fulfill the parametric assumptions [14-15]. Therefore, Whitney U test and Kruskal-Wallis variance analysis were applied to these dimensions. Confirmatory Factor Analysis (CFA) examines the degree of validation of a predetermined or designed structure, by using the total data [16]. Since the original scale used in this study was not used by any researcher before, DFA could not be performed for the research results. 2.Method 2.1.Population and Sample The population of this study is composed of eighteen (18) and older individuals living in the Isparta city center. According to the data of 2016 of the Directorate of Civil Population of Isparta, the population of the research consists of 147,334 people5. As is known, it is not possible to give a clear number about how much the sample should be in a research. Considering the present population size, a sample consists of approximately 384 individuals is considered sufficient for this population to provide a 5% error tolerance and a 95% confidence level [13]. Four hundred people were reached in the study and all of the surveys were taken into consideration. The sample of the study was selected by the convenience sampling method6 and the participants were determined in this way. 2.2.Data Collection Tool The studies conducted in the literature review stage of the study revealed that, no suitable scale was found for the purpose of the research. Therefore, the questions of the survey were formed by the researcher in accordance with the conceptual framework obtained from the literature review. While creating the questions of the survey; interviews were made by relevant experts. As a result of these interviews, a question pool consist of 350 questions was obtained. These 350 questions were classified by the researcher in accordance with the conceptual framework in the literature and reduced to approximately 100 questions. These 100 questions were reduced to 63 questions in a brainstorming session at a meeting with the participation of some academicians working in the field. Nine of these questions were prepared in order to obtain demographic information and 54 of them in 5-Likert Scale format. In addition, one of the 54 questions was used as a control question7. After taking the final form of the questionnaire, it was found that the expressions consisted of the following 7 dimensions; merit, external influences and politics, trust and loyalty, school and business environment, ethnic origin and sect, representation and talent, relatives and citizenship. With a pilot application, including 100 people, the survey, including 63 questions, was tested in the field. Interviewers were used to implement the survey. Expressions of the participants were evaluated with an equally divided score ranges in the range of 1 to 5 points; Totally disagree (1.0- 1.79), Partially Disagree (1.80-2.59), Partially Agree (2.60- 3.39), Mostly Agree (3.40-4.19), Totally Agree (4.20-5.0). 3.Findings 3.1.Demographic Findings Table1. Distribution of Participants According to Demographic Variables Variables Age (Years) 18-29 30-39 40 + Total Sex Male Female Total Marital Status Married Single Total Monthly Income (TL) -1500 TL 1501-2500 TL 2501-3500 TL 3501+ TL Total Education Level -High School Associate degree College+ Total Employment Sector Public Private Retired Un-employed Total Worked in any Public Management Team Yes No Total Grand Total Frequency Percent 152 102 123 377 40.3 27.1 32.6 100 262 115 377 69.5 30.5 100 255 115 370 68.9 31.1 100 51 89 147 65 352 14.5 25.3 41.8 18.4 100 105 111 158 374 28.1 29.7 42.2 100 2.3.Analysis Method Quantitative research was integrated in the study and SPSS (SPSS 16.0 for Windows, SPSS Inc. Chicago, IL, USA) software was used in the statistical analysis of the data. Arithmetic mean, standard deviation, frequency and percentage calculations were performed to obtain descriptive statistics on the collected data. Statistical evaluations of the research were performed by using the averages obtained from these calculations. The data were subjected to normality test and 5http://www.ysk.gov.tr/ysk/docs/2011MilletvekiliSecimi /SecmenSandik2011.htm. (07.01.2017) 6A non-probability/non-random sampling technique. 7To increase the reliability of the application, the 40th question was used as a control question. 213 117 13 20 363 58.7 32.2 3.6 5.5 100 53 280 333 400 15.9 84.1 100 100.0 @ IJTSRD | Unique Reference Paper ID – IJTSRD21508 | Volume – 3 | Issue – 2 | Jan-Feb 2019 Page: 834
International Journal of Trend in Scientific Research and Development (IJTSRD) @ www.ijtsrd.com eISSN: 2456-6470 3.2.Arithmetic Mean and Standard Deviation Findings Table 2. Findings of the Factors Expressed by the Participants about the Tendency of Turkish Public Administrators' (TPA) Manager Choice Factor Load 0.712 0.670 0.570 0.595 0.796 0.743 0.476 No. EXPRESSIONS SS X 1 2 3 4 5 6 7 TPM prefers the relatives and acquaintances while selecting managers. TPM prefers their fellow citizens while selecting managers. TPM prefers people who are in their group of friends, while selecting managers. TPM prefers people who graduated from same school, while selecting managers. TPM prefers people who have same political view, while selecting managers. TPM prefers people who have the same profession, while selecting managers. TPM prefers people who are members of the same union, while selecting managers. TPM prefers people who are members of the same religious group, while selecting managers. The bureaucratic pressure arising from the upper tiers is effective for TPM while selecting managers. Ethnic origin (Turkish, Kurdish, Laz, Cherkes etc.) of the candidate is effective for TPM while selecting managers. Financial gain is effective for TPM while selecting managers. 4.7680.582 4.7550.588 4.7050.632 4.5050.855 4.8480.458 4.4920.958 4.8250.539 8 4.8020.570 0.487 9 4.8030.499 0.760 10 4.5600.853 0.898 11 4.6770.781 0.514 Factor Load No. EXPRESSIONS SS X The pressures of the private sector companies through politics are effective for TPM while selecting managers. Social perception (communitarianism, communist, follower of sharia, leftist/rightist etc.) about the executive candidates is effective for TPM while selecting managers. The perception (communitarianism, communist, follower of sharia, leftist/rightist etc.) of senior bureaucrats and politicians about the executive candidates is effective for TPM while selecting managers. The way in which the manager obtains his position (politics, sect, communitarianism, union, merit, etc.), is effective for TPM while selecting managers. TPM prefers sycophant people while selecting managers. TPM prefers people from the leading families of the city while selecting managers. The Sect (Sunnism, Alawism etc.) of the candidate is effective for TPM while selecting managers. TPM prefers people who worked with them before while selecting managers. 12 4.6830.684 0.424 13 4.8000.548 0.791 14 4.7820.544 0.807 15 4.7590.542 0.798 16 17 4.6750.700 4.2311.124 0.538 - 18 4.3751.038 0.893 19 4.4990.906 - Factor Load 0.530 0.951 0.973 No. EXPRESSIONS SS X 20 21 22 The Intelligence of the candidate is effective for TPM while selecting managers. The loyalty of the candidate is effective for TPM while selecting managers. The faithfulness of the candidate is effective for TPM while selecting managers. The privacy and secrecy behavior of the candidate is effective for TPM while selecting managers. TPM prefers people who was taken part in the management team of one of the previous managers, while selecting managers. Professional reference is effective for TPM while selecting managers. TPM considers providing a social equilibrium in a way that constitutes the mosaic structure (where every section is fairly represented) while selecting managers. TPM considers the requests/demands of the lower levels within the organization, while selecting managers. TPM considers professional reference while selecting managers. TPM considers the requests of managers of the other organizations, while selecting managers. 1.7291.076 3.8871.494 3.8601.519 23 3.8421.557 0.958 24 1.4770.963 0.760 25 4.1801.295 0.854 26 1.4470.922 0.713 27 3.6481.513 - 28 3.6501.638 - 29 4.6400.814 0.422 Factor Load 0.546 No. EXPRESSIONS SS X 30 TPM prefers people who have a common motivation feature, while selecting managers. TPM considers the potential of the candidate for being a competitor in the future while selecting managers. TPM prefers people who do not give up their values while selecting managers. TPM prefers people who have a High Level Questioning Ability, while selecting managers. TPM prefers well-educated people while selecting managers. TPM prefers people who have the highest specialized knowledge in the field to be studied, while selecting managers. TPM prefers experienced people in the field to be studied, while selecting managers. 1.9901.319 31 4.4651.089 - 32 1.4320.864 - 33 1.5020.788 0.768 37 1.6460.955 0.763 38 1.6210.863 0.907 39 1.6900.955 0.809 @ IJTSRD | Unique Reference Paper ID – IJTSRD21508 | Volume – 3 | Issue – 2 | Jan-Feb 2019 Page: 835
International Journal of Trend in Scientific Research and Development (IJTSRD) @ www.ijtsrd.com eISSN: 2456-6470 40 41 42 43 44 TPM prefers while selecting managers this is a control question, please mark 1. TPM prefers people who have teamwork skills, while selecting managers. TPM prefers people who have vision, while selecting managers. TPM prefers people who have succeeded in the field before, while selecting managers. TPM prefers people who have high communication abilities, while selecting managers. 1.00 1.5100.824 1.5960.975 1.6230.918 1.5500.871 0 - 0.770 0.742 0.803 0.808 Factor Load 0.754 No. EXPRESSIONS SS X 45 TPM prefers people who display high adaptive skills, while selecting managers. TPM prefers people who have a better foreign language knowledge, while selecting managers. TPM prefers people who can use the technology in a better way, while selecting managers. TPM prefers hardworking people while selecting managers. TPM prefers people with high levels of personal morality while selecting managers. TPM prefers people with high levels of professional morality while selecting managers. TPM prefers people who display high levels of equity law, while selecting managers. TPM prefers people with sharing talent while selecting managers. TPM prefers challenging people while selecting managers. TPM prefers people who display high levels of problem solving ability, while selecting managers. 1.5360.884 46 1.6721.097 0.700 47 1.6190.998 0.750 48 49 50 51 52 53 1.6471.008 1.6600.993 1.5980.934 1.5720.923 1.5320.928 1.5420.914 0.862 0.739 0.727 0.761 0.886 0.884 54 1.5050.931 0.924 Merit Dimension External Influences and Politics Dimension Trust and Loyalty Dimension School and Business Environment Dimension Ethnic Origin and Sect Dimension Representation and Talent Dimension Relatives and Citizenship Dimension As a result of the examination; the expressions in the 17, 19, 27 and 28th questions, which were found to be overlapped, were removed from the scale. On the other hand, the expressions in the 31st and 32th questions, which were found to be single factors because they consisted of only one question, were excluded from the scale. Finally, the control question in the 40th expression, which was used to increase the reliability of the study, was also excluded from the scale. In summary, seven expressions in the 17, 19, 27, 28, 31, 32 and 40th questions were excluded from the scale of the study for various reasons mentioned above. The number of valid expressions in the scale was determined as 47 (21 + 12 + 4 + 3 + 2 + 3 + 2). According to the highly-rated factors expressed by the participants, the factors that considered as important for Turkish public administrators while selecting their management teams, are listed below respectively; ?Having same political view, ?Being a member of the same union, ?The situation of bureaucratic pressure from the upper tiers, ?Being in the same religious group, ?Social perception (communitarianism, communist, follower of sharia, leftist/rightist etc.) about the executive candidates to be selected for the team, Excluded From Evaluation ?The perception (communitarianism, communist, follower of sharia, leftist/rightist etc.) of senior bureaucrats and politicians about the manager candidates to be selected for the team, ?to be one of close relatives and acquaintances, ?The way in which the administrator obtains his position (politics, sect, communitarianism, union, merit, etc.), ?Being a fellow citizen, ?Being one of the friends. According to the low-rated factors expressed by the participants, the factors that considered as less important Turkish public administrators while selecting their management teams, are listed below respectively; ?Displaying a high level of Innovation, ?Displaying a high level of communication ability, ?Initiative, ?Displaying a high level of adaptive skill, ?Having sharing abilities, ?Having teamwork skills, ?Displaying a high level of problem solving ability, ?Having a high level of questioning ability, ?To have taken part in the management team of one of the previous managers, ?Making the selection of executives by considering the social equilibrium in a way that constitutes the mosaic structure (where every section is fairly represented). @ IJTSRD | Unique Reference Paper ID – IJTSRD21508 | Volume – 3 | Issue – 2 | Jan-Feb 2019 Page: 836
International Journal of Trend in Scientific Research and Development (IJTSRD) @ www.ijtsrd.com eISSN: 2456-6470 Table3. Descriptive Statistical Data of the Factors Trust and Loyalty Expressions 3.3.KMO and Barlett Test Findings Table4. KMO and Barlett Test Results Kaiser-Meyer-Olkin Test for Sampling Adequacy Chi-Square Approximation Degree of Freedom Significance According to the Table 4, the KMO value of the scale is 0.93. Considering the table created by Sipahi et al. including KMO values and comments; it is determined that the suitability level of the variables used in this study to the factor analysis is excellent [18]. Kalaycı also states that the higher the KMO value, the better the dataset is for factor analysis [17]. Bartlett's Test of Sphericity is used to examine the hypothesis that the variables of the main structure are unrelated or not. According to the “0” value indicated in the Table 7, which fulfills the p<0.01 condition, results of the Bartlett's Test of Sphericity used in the study are significant. 4.Discussion and Conclusions According to the results obtained from the dimensions of the research, the public perception about the factors that affecting Turkish public administrators' manager choice can be summarized as follows: The public perception about the Merit Factor: According to the public perception, the Merit Factor is not a determinative factor for Turkish public administrators' manager choice. The public perception about the External Influences and Politics Factor: According to the public perception, the External Influences and Politics Factor is a determinative factor in Turkish public administrators' manager choice. The public perception about the Trust and Loyalty Factor: According to the public perception, the Trust and Loyalty Factor is a determinative factor in Turkish public administrators' manager choice. The public perception about the School and Business Environment Factor: According to the public perception, the School and Business Environment Factor is a determinative factor in Turkish public administrators' manager choice. The public perception about the Ethnic Origin and Sect Factor: According to the public perception, the Ethnic Origin and Sect Factor is a determinative factor in Turkish public administrators' manager choice. The public perception about the Representation and Talent Factor: According to the public perception, the Representation and Talent Factor is definitely not a determinative factor in Turkish public administrators' manager choice. The public perception about the Relatives and Citizenship Factor: According to the public perception, the Relatives and Citizenship Factor is a determinative factor in Turkish public administrators' manager choice. As a result of the study, it was determined that the public perception about the effective factors for Turkish public Ethnic Origin and Representation Influences and Relatives and Environment DIMENSIONS Citizenship School and and Talent 0.933 Business External Politics Merit Bartlett's Test of Sphericity Sect 17018.589 1378 0 Number of 21 12 4 3 2 3 2 1.608 4.749 3.830 4.390 4.467 1.550 4.761 1)x̄ 0.743 0.425 1.408 0.852 0.848 0.736 0.559 SS 0.969 0.900 0.932 0.727 0.748 0.598 0.906 α Skewness -4.298 -0.707 -1.861 -2.343 -3.862 2.166 2.043 Kurtosis 26.681 19.576 -1.209 3.541 5.848 4.649 5.47 In accordance with the ranking results of the factor analysis, statistical analyzes was performed on the 47-item scale and its dimensions. As a result of the analysis, Cronbach Alpha reliability coefficients, arithmetic mean, standard deviation, Skewness and Kurtosis values were calculated for all dimensions of the scale. According to the obtained results; because of the Skewness (-0.707) and Kurtosis (-1.209) values of the Trust and Loyalty Dimension was in the range of -1.96 to +1.96, this dimension was accepted as displaying a normal (parametric) distribution [14-15]. Other dimensions did not display a normal distribution, because the Skewness and Kurtosis values of these dimensions were not in the range of -1.96 to +1.96 [14-15]. According to the Cronbach Alpha (α) coefficient, the confidence intervals of the dimensions in the study are as follows: Merit Dimension, Relatives and Citizenship Dimension, External Influences and Politics Dimension and Trust and Loyalty Dimensions were determined as display “high reliability” because of these dimensions fulfill the 0.80≤α<1.00 condition [17]. The School and Business Environment and Ethnic Origin and Sect Dimensions were determined as display “moderate reliability” because of these dimensions fulfill the 0.60≤α<0.80 condition. And, the Representation and Talent Dimension was determined as display “low reliability” because of this dimension fulfill the 0.40≤α<0.60 condition. @ IJTSRD | Unique Reference Paper ID – IJTSRD21508 | Volume – 3 | Issue – 2 | Jan-Feb 2019 Page: 837
International Journal of Trend in Scientific Research and Development (IJTSRD) @ www.ijtsrd.com eISSN: 2456-6470 administrators' manager choice, the age, gender and marital status variables did not show a statistically significant difference. However, it was found that, monthly income level, education level, employment sector and experience variables displayed significant statistical differences in the perceptions of meritocracy or in the perceptions of favoritism. As a result of the examination of three variables (monthly income level, education level and employment sector), which were determined as an effect on favoritism behavior while selecting managers, it was determined that the opinions of the participants were gathered in two contrasting views. These opinions and qualifications of the participants are as follows; ?Participants, who have a possibility to be a public administrator and who have knowledge about the process of selection of managers (high-income, college graduate and public employee), have an opinion that favoritism is effective in the selection of public administrators. ?Participants, who have not a possibility to be a public administrator and who have less knowledge about the process of selection of managers compared to the previous group (low income, high school or lower educated and working in the private sector), have an opinion that the merit is effective in the selection of public administrators. Çelik and Erdem also stated that the favoritism perception of the employees, who are more familiar with the promotion process, are higher than those beginner employees, who are less familiar or unfamiliar with the promotion process [19]. The difference between the perceptions of these two groups is explained by the fact that the employees who more familiar with the promotion process have more information than the others. Pelit et al. state that there are differences in the favoritism perceptions of the private sector employees also [20]. Some studies revealed that there is no statistically significant relationship between characteristics of the employees and their favoritism perception in the private sector, where administrative and organizational dynamics are very different from the public sector [21]. The experience variable, which has been found to affect the favoritism perception, is another remarkable aspect of the research. The opinions of the participants, who have worked as public administrator before and still have the opinion that meritocracy principles are effective, are contradicted by the general results of the study. However, due to the fact that the participants included the individuals who had previously worked as public administrators (experienced participants who expressed exceptional views in the research), the possibility of not expressing objective opinions while answering the survey was taken into account. It was observed that the experienced participants, who are considered as exceptional group and who have previously served as public administrator, contradict with their opinions about the merit criteria in their answers of some other questions. For example, participants who have the opinion of merit is a determinative factor in the selection of public administrators (who served as public administrator) have been contradicted by responding to another question of the survey as “old managers are not preferred in new manager selections”. Therefore, it was thought that the exceptional opinion of this group would not affect the results of the study. Similarity between the results of this research with the results of the other researches performed in Turkey and international literature were observed. The negative effects of the favoritism perception on the employees were reported in multiple studies [22-23]. Suggestions developed to eliminate the favoritism perception, which differing according to the demographic variables, about the selection of the Turkish public administrators, is as follows: The necessary legislative regulations should be made for the implementation of the meritocracy principles in the selection of Turkish public administrators. ?A transparent and reliable promotion process should be developed for all employees who has the possibility to be a public administrator. ?A higher order board should be established to assess the performance of the public managers and to perform a penalty and reward mechanism. ?It is suggested that future researchers working on this subject can achieve deeper results by using qualitative research methods from different perspectives. REFERENCES [1]Çetinkaya, M., & Özutku, H. (2012). Yönetsel Performansa Yetkinlik Temelli Yaklaşım: Türk Otomotiv Sektöründe Turkish). İstanbul Üniversitesi İşletme Fakültesi Dergisi, 41(1): 142-161. Bir Araştırma (in [2]Zaccaro, S. J., & Banks, D. (2004). Leader Visioning and Adaptability: Bridging The Gap Between Research and Practice on Developing The Ability to Manage Change. Human Resource Management Journal, 43(4): 367-380. [3]Shirazi, A., & Mortazavi, K. (2009). Effective Management Performance A Competency Based Perspective. İnternational Review of Business Research Papers, 5(1): 4-10. the demographic [4]Kubica, A. J. (2008). Transcitioning Middle Managers. Healthcare Executive, 23(1). [5]Broscio, M., & Scherer, J. (2003). Bulding Job Security: Strategies for Becoming A Highly Valued Contributor. Journal of Healthcare Management, 48(4): 147-151. [6]Mooney, A. (2007). Core Competence, Distinctive Competence and Competitive Advantage: What Is The Difference? Journal of Education for Business, 83(2): 110-115. [7]Argüden, Y. (2007). Yönetim Kurulu Sırları (in Turkish). İstanbul: Rota Yayın Yapım Tanıtım Tic. Ltd. Şti. [8]Erdem, R. (2010). Yönetim ve Örgüt Açısından Kayırmacılık. E. Dikmetaş içinde, Meritokrasi ve Gelişimi (in Turkish) (pp. 203). İstanbul: Beta Basım Yayım Dağıtım A.Ş. [9]Özkanan, A., & Erdem, R. (2014). “Yönetimde Kayırmacı Uygulamalar: Kavramsal Bir Çerçeve” (in Turkish). Süleyman Demirel Üniversitesi Sosyal Bilimler Enstitüsü Dergisi (SDÜİİBFD), 2(20): 179-206. [10]Paxton, R. O. (2004). Faşizmin Anatomisi (in Turkish). İstanbul: İletişim Yayıcılık A.Ş. @ IJTSRD | Unique Reference Paper ID – IJTSRD21508 | Volume – 3 | Issue – 2 | Jan-Feb 2019 Page: 838
International Journal of Trend in Scientific Research and Development (IJTSRD) @ www.ijtsrd.com eISSN: 2456-6470 [11]Bozkurt, Ö., Ergun, T., & Sezen, S. (2011). Kamu Yönetimi Sözlüğü (in Turkish). Ankara: TODAİE Yayını. [20]Pelit, E., Baytok, A., Soybalı, H., & Kılıç, İ. (2017). Nepotizm Algısında Demografik Özelliklerin Rolü: Otel İşletmeleri İşgörenleri Üzerinde Bir Araştırma (in Turkish). Türk Turizm Araştırmalaları Dergisi, 1(2): 45- 63. [12]Aktan, C. C. (2001). Yolsuzlukla Mücadele Stratejileri (in Turkish). Ankara: Hakiş Yayınları. [13]Kan, İ. (1998). Biyoistatistik (in Turkish). Bursa: Uludağ Üniversitesi Basımevi. [21]Erdem, B., Çeribaş, S., & Karataş, A. (2013). Otel İşletmelerinde Çalışan İşgörenlerin Kronizm (Eş-Dost Kayırmacılığı) Algıları: İstanbul'da Faaliyet Gösteren Bir, İki ve Üç Yıldızlı Otel İşletmelerinde Bir Araştırma (in Turkish). Çukurova Ünversitesi İİBF Dergisi, 17(1): 51-69. [14]Can, A. (2014). SPSS ile Bilimsel Araştırma Sürecinde Nicel Veri Analizi (in Turkish). Ankara: Pegem Akademi. [15]Akgül, A., & Çevik, O. (2005). İstatistiksel Analiz Teknikleri (in Turkish). Ankara: Emek Ofset. [22]Büte, M. (2011). Kayırmacılığın Çalışanlar Üzerine Etkileri İle İnsan Kaynakları Uygulamaları İlişkisi: Türk Kamu Bankalarına Yönelik Bir Araştırma (in Turkish). Atatürk Üniversitesi Sosyal Bilimler Enstitüsü Dergisi, 15(1): 383-404. [16]Seçer, İ. (2013). SPSS ve LİSREL ile Pratik Veri Analizi (in Turkish). Ankara: Anı Yayıncılık. [17]Kalaycı, Ş. (2008). SPSS Uygulamalı Çok Değişkenli İstatistik Teknikleri (in Turkish). Ankara: Asil Yayın Dağıtım. [23]Karahan, A., & Yılmaz, H. (2014). Nepotizm ve Örgütsel Bağlılık Arasındaki İlişkinin İncelenmesi ve Bir Uygulama (in Turkish). Selçuk Üniversitesi İktisadi ve İdari Bilimler Fakültesi Araştırmalar Dergisi (The Journal of Social and Economic Research), 14(27): 23-148. [18]Sipahi, B., Yurtkoru, S., & Çinko, M. (2006). Sosyal Bilimlerde SPSS’le Veri Analizi (in Turkish). İstanbul: Beta Yayınları. Sosyal ve Ekonomik [19]Çelik, K., & Erdem, A. R. (2012). Üniversitede Çalışan İdari Personele Göre Kayırmacılık (in Turkish). Akdeniz Eğitim Araştırmaları Dergisi, 11: 23-30. @ IJTSRD | Unique Reference Paper ID – IJTSRD21508 | Volume – 3 | Issue – 2 | Jan-Feb 2019 Page: 839