Download
1 / 6
60 likes | 191 Views
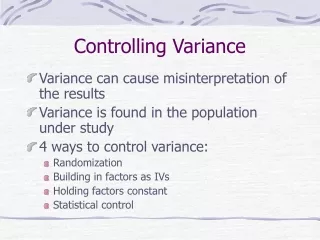
Controlling Variance. Variance can cause misinterpretation of the results Variance is found in the population under study 4 ways to control variance: Randomization Building in factors as IVs Holding factors constant Statistical control. Teacher/ Curriculum A. 50 students randomly

E N D
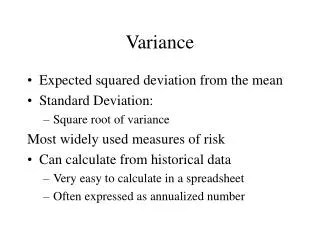
Controlling Variance • Variance can cause misinterpretation of the results • Variance is found in the population under study • 4 ways to control variance: • Randomization • Building in factors as IVs • Holding factors constant • Statistical control
Teacher/ Curriculum A 50 students randomly assigned to Group 1 Performance on a geography test Teacher/ Curriculum B 50 students randomly assigned to Group 2 Performance on a geography test Teacher/ Curriculum C 50 students randomly assigned to Group 3 Performance on a geography test Randomization Random selection, or assignment, of subjects spreads the effect of whatever is causing the variance, evenly across the participating groups. Study comparing curricula A, B, & C
Curriculum A High Ability 25 students Geography test Curriculum A Low Ability 25 students Geography test Curriculum B High Ability 25 students Geography test Curriculum B Low Ability 25 students Geography test Curriculum C High Ability 25 students Geography test Curriculum C Low Ability 25 students Geography test Factors as Independent Variables Include factors causing variance as independent variables in the study. Study comparing curricula A, B, & C
Holding Factors Constant Reduce the influencing factor (or variable) to a constant. Curriculum A 50 Low Ability students ran- domly assigned to Group 1 Performance on a geography test Curriculum B 50 Low Ability students ran- domly assigned to Group 2 Performance on a geography test Curriculum C 50 Low Ability students ran- domly assigned to Group 3 Performance on a geography test Study comparing curricula A, B, & C
Let’s Try One The researcher is seeking to determine the effects of two different cohort programs on a heterogeneous sample of educational administration students at California State University. • Sample: 100 students • 1st & 2nd year • White, African American, Southeast Asian, Latino/a • All have 3 – 5 years teaching experience • Cohort Programs • Urban Leadership Emphasis • Bilingual Leadership Apply the Holding Factors Constant strategy to the study.
Now You Try It! What is the best way to teach 5th grade students who are reading below grade level in Sacramento schools? • Describe the population. • Identify one factor that may cause variance. • Describe 3 samples, using each of the first 3 strategies to control variance. Post your responses to WebCT under the forum, HW 7.