Download
1 / 6
60 likes | 159 Views
Explore the breakdown of U.S. exports and imports by region in 2004, including trade with OPEC, Central and South America, Canada, Mexico, Pacific Rim, and the European Union. Delve into the Group of 8 countries, trade deficits, surpluses, and the impact of U.S. immigration over the years.

E N D
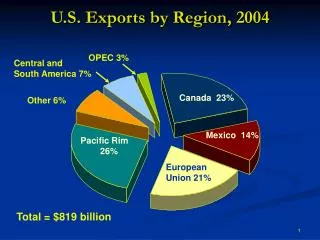
U.S. Exports by Region, 2004 OPEC 3% Central and South America 7% Canada 23% Other 6% Mexico 14% Pacific Rim 26% European Union 21% Total = $819 billion
U.S. Imports by Region, 2004 OPEC 6% Central and South America 7% Other 6% Canada 17% Mexico 11% Pacific Rim 33% European Union 19% Total = $1,470 billion
International Trade • Group of 8 – G8 • US • Japan • Germany • France • UK • Italy • Canada • Russia
Balance of Trade • Balance of trade – the difference between the value of exports and the value of imports. • Trade deficit – imports > exports • Trade surplus – exports > imports • The U.S. has a significant trade deficit of approximately 5% of GDP. • The U.S. is financing its trade deficit by selling off financial assets, stocks and bonds, and real assets, corporations and real estate.
U S Immigration, Number and Rate: 1900 to 2001, by Decade