Download
1 / 26
270 likes | 460 Views
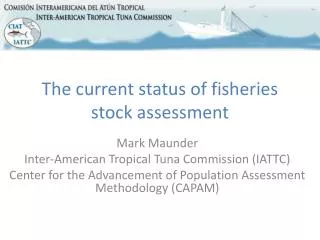
The current status of fisheries stock assessment. Mark Maunder Inter-American Tropical Tuna Commission (IATTC) Center for the Advancement of Population Assessment Methodology (CAPAM). Outline. The World Conference on Stock Assessment Methods Current uncertainties

E N D
The current status of fisheries stock assessment Mark Maunder Inter-American Tropical Tuna Commission (IATTC) Center for the Advancement of Population Assessment Methodology (CAPAM)
Outline • The World Conference on Stock Assessment Methods • Current uncertainties • Modeling temporal variation in catch composition data
The World Conference on Stock Assessment Methods • Workshop (15th-16th July 2013) • Different models fit to real and simulated data • Conference (17th-19th July 2013) • Key Challenges for Single Species Assessments • Assessing Ecosystem Dynamics & Structure • Spatial Complexity and Temporal Change • Data Poor Approaches • Abstracts and presentations on line • http://www.ices.dk/news-and-events/symposia/WCSAM-2013
Workshop: conclusions • Different models applied to the same data produce different results • Different models applied to data simulated by other models can perform poorly • Many assumptions differ among the models, so difficult to interpret results
XSA SCA SAM XSA simulated SAM simulated SCA simulated From Doug Butterworth and colleagues
Workshop analyses: selectivity assumptions • Extended survivors analysis (XSA) • Age and year specific F • State-space assessment model (SAM) • Random walk in F at age • Statistical catch-at-age analysis (SCA) • Separable (constant selectivity) with three time blocks
Uncertainties • Stock-recruitment relationship • Natural Mortality • Growth • Selectivity • Catchability • Spatial distribution
Stock-recruitment relationship • Simulations studies show that estimates of the stock-recruitment relationship are usually Biased and imprecise • Highly influential on management quantities
Natural Mortality • Lack of direct information (tagging data) • Indirect methods (maximum age, life history relationships) are imprecise and probably biased • Estimate inside the stock assessment model • Highly influential on management quantities
Growth • More uncertain than generally considered • Asymptotic length particularly influential on fishing mortality and abundance estimates when using length composition data
Selectivity • Misspecification can cause biased estimates of management quantities • Inflexible functional forms • Time varying selectivity • Allowing flexible selectivity reduces information content of composition data
Catchability • Scales an index of abundance to absolute abundance • Usually unknown or more uncertainty than assumed
Spatial distribution • Temporal variation in fishery or stock spatial distribution can cause biases
Modeling temporal variation in catch composition data • Most stock assessments use catch-at-age or catch-at-length data • Composition data have too much influence on the results of integrated assessments
Why does composition data vary from year to year • Recruitment strength • Fishing mortality history • Sampling error • Temporal variability in selectivity • Other process variation • Spatial distribution of fleet and stock
Recruitment strength • Relative cohort strength is consistent from one year to the next • Estimate as model parameters
Fishing mortality history • High F = no old fish; Low F = many old fish • Changes slowly over time • Estimated in model from catch information
Sampling error • Different random sample different age composition • Important when sample size is low • Schooling by size reduces effective sample size • Estimate effective sample size by bootstrapping the sampling process
Temporal variability in selectivity • Gear changes • Use selectivity time blocks when gear changes • Combining fisheries and changes in fishing effort among fisheries (e.g. VPA) • Don’t combine fisheries or alternatively use time varying selectivity • Cohort targeting • Model time varying or cohort specific selectivity
Growth • Temporal variation in growth may interact with length based selectivity • Use year specific growth parameters if available
Natural mortality • Most important for young ages due to predation • Temporal variation of young fish not vulnerable to the fishery accounted for in recruitment estimates • May be important for small sized species
Temporal variation in the spatial distribution of fleet or stock • May be a major contributor to variation in composition data • Can cause logistic contact selectivity to be dome shape at the stock assessment model level and change over time Young Young Old Old
Modeling temporal variation in catch composition data: summary • Account for recruitment as parameters in the model • Fishing mortality is estimated from catch information • Account for sampling error by bootstrapping the sampling process • Use annual estimates of growth if available • Determine if the model is robust to temporal variation in natural mortalityand growth • Model multiple fisheries to account for differences among gears • Estimate the amount of selectivity temporal variation inside the model (state-space model) to account for spatial variation
Presentation summary • Different model assumptions (e.g. selectivity) can give different results • There is a lot of uncertainty about most population dynamics and fishing processes • Models need to account for temporal variability in selectivity
Conclusion We either need to put a lot more focused effort into resolving the uncertainties Or Develop management strategies that are robust to the uncertainty