Download
1 / 28
280 likes | 368 Views
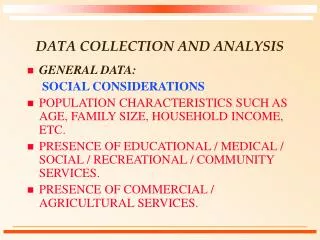
at the Mitchell Institute 22 Monument Square, Suite 404 Portland, Maine 04101 GreatSchoolsPartnership.org. Ensuring Quality Instruction Through Data Collection, Analysis, and Reflection. Presenters Duke Albanese & David Ruff Co-Executive Directors Great Schools Partnership.

E N D
at the Mitchell Institute22 Monument Square, Suite 404Portland, Maine 04101GreatSchoolsPartnership.org
Ensuring Quality Instruction Through Data Collection, Analysis, and Reflection Presenters Duke Albanese & David Ruff Co-Executive Directors Great Schools Partnership September 12, 2007 2007 Education Leaders Conference
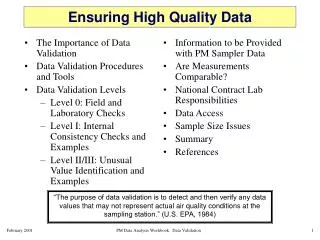
Strengthening Today’s Schools for the World of Tomorrow Our Vision An equitable, academically rigorous, and personalized public education system that prepares all students for college, work, and citizenship.
Our Mission In collaboration with Maine and national educators, develop, implement, and advocate for high-quality instructional practice; effective and expanded leadership capacity; and student-centered organizational design and culture, all built on strong community connections that lead to the realization of our vision.
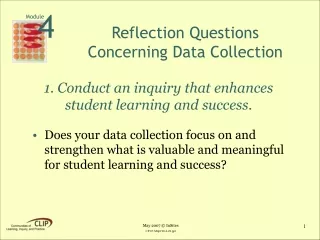
Table Conversation What roadblocks (logistical, financial, cultural, and emotional) hamper the collection and analysis of data on instructional practice? What impedes this analysis from impacting teacher beliefs and practices as well as overall school change?
Concerns We’ve Been Hearing • Traditional evaluation and supervision procedures are infrequent and disconnected from instructional improvement • Limited time and capacity to conduct classroom observations • No collective understanding of the prevailing instructional strategies, patterns, and trends within a school or district • No “hard” data on classroom instruction • Faculties don’t know where to begin or what to address • Busy schedules and large workloads postpone or impede instructional improvement • Fear
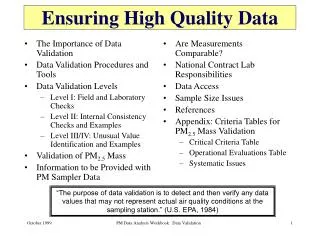
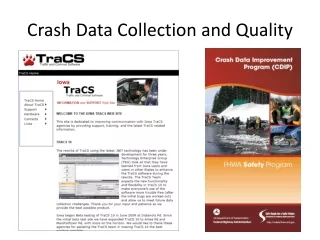
The iWalkthrough Tools and Process • Based on relatively short, but frequent, classroom observations that are collected over time • Focused on clearly observable characteristics that are tied to improving student achievement and aspirations • Records, archives, and visually displays data electronically, eliminating paper work and increasing time for thoughtful conversations on instruction • Establishes credibility and staff buy-in through broad participation in data collection and analysis • Enables educators to generate detailed, customized reports on individual, departmental, and school-wide instructional patterns and trends
Examples in Practice Sacopee Valley High School • Rural high school of 450 students • 800 observations conducted in 2006-2007 • Principal, assistant principal, and teacher-leaders record and analyze observations as part of their ongoing responsibilities • Observation process built into faculty expectations • System in place for regular grade-level analysis
Examples in Practice Oxford Hills Comprehensive High School • Rural consolidated high school of 1,250 students from dozens of sending communities • 700 observations conducted in 2006-2007 • Observations conducted by principal, assistant principal, and grade-level teacher-leaders • System in place for regular grade-level, multi-grade, and cross-teams analysis
Examples in Practice • Urban high school of 1,000+ students • 750 observations conducted in 2006-2007 • All teachers trained to conduct observations • All teachers are expected to team up with a colleague and complete a series of observations • System in place for analyzing data within each content area
Content Area • Grade Level • Class Size • Visit Time • Engagement in Learning • Bloom’s Taxonomy Level • Class Configuration • Teacher Interactions • Student Interactions • Learning Approaches • School Choice • Date of Observation Observation Form Categories
Teacher Interactions Data Fields • Coaching/conferencing • Facilitating discussion • Monitoring • One-on-one • Posing questions • Presenting • Independent teacher work
Student Engagement and Bloom’s Taxonomy
Examining Student Engagement and Bloom’s Taxonomy Table Conversation How would you interpret these data?
Table Conversation • If these data had been collected in a school, what strategies and professional development would you use to begin improving the quality of classroom instruction? • If these data had been collected in your state or district, what policies, strategies, and professional development would you use to begin improving the quality of classroom instruction?
Lessons Learned • Changing instructional beliefs requires educators having the ability to archive, sort, and compare data from classroom observations on their time table. • Educators need immediate, real-time data on instruction to influence their practice. • Educators need practical and targeted information to identify the most important school-wide instructional needs for professional development. • MORE
Lessons Learned • Growth requires the ability to archive and use data over multiple years. • Deep understanding of practice requires educators being able to disaggregate observation data by date, content area, grade level, and several other criteria. • Instructional observation systems need to maximize conversations and focus on bettering instruction rather than on process and data collection. • MORE
Lessons Learned • Hands-on tools and process encourage more active participation of school administrators in the instructional life of their school, fostering a greater understanding of school-wide curricula, instruction, and assessment. • Participation by the faculty (more is better) encourages greater investment in and support for instructional improvement. • When educators can manipulate data to get at the issues that matter most to them, we see more rapid changes in instructional beliefs and practices.
Questions about… The iWalkthrough process? How schools have used the tools? How the system has impacted instructional practices? What we’ve learned about changing instruction?
at the Mitchell Institute 22 Monument Square, Suite 404 Portland, ME 04101 207.773.0505 Fax 207.773.4044 GreatSchoolsPartnership.org