Download
1 / 31
310 likes | 326 Views
Explore the U.S.'s response to the energy-climate nexus, rising sea levels, and the need for clean energy transition. Discover the role of natural gas, carbon pricing, and the power sector in leading the way. Join Dr. Marilyn A. Brown on June 18, 2019, for an enlightening talk at the Oxford University Center for the Environment Energy Colloquium.

E N D
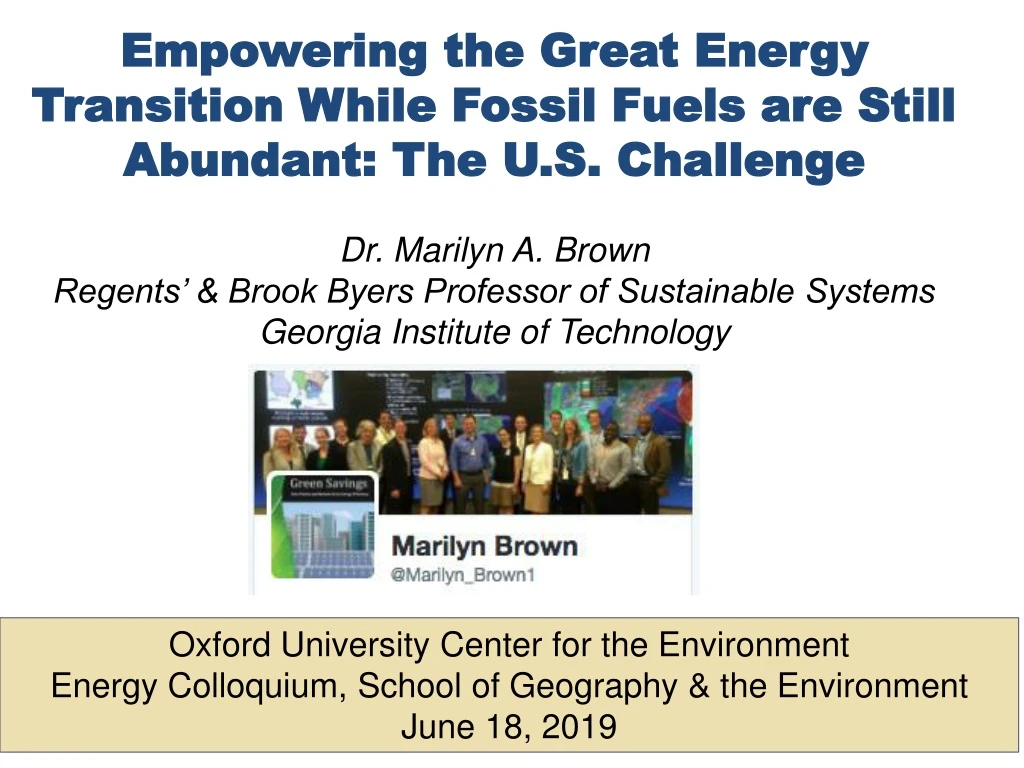
Empowering the Great Energy Transition While Fossil Fuels are Still Abundant: The U.S. ChallengeDr. Marilyn A. BrownRegents’ & Brook Byers Professor of Sustainable SystemsGeorgia Institute of Technology Oxford University Center for the Environment Energy Colloquium, School of Geography & the EnvironmentJune 18, 2019
The Energy-Climate Nexus 2016 temperatures compared to normal around the globe (Source: NOAA) 2015-18 = Four Hottest Years on record “…human activities, especially emissions of greenhouse gases, are the dominant cause of the observed warming .…” (Source: National Climate Assessment Special Report 2017)
Sea Level: A Rising Concern The ultimate melting of ice sheets in Greenland and Antarctica could result in sea-level rise of 80 meters. • Greenland: 6-7 m • West Antarctica: 6-8 m • East Antarctic Ice Sheet: 65-67 m But global warming does not provide enough heat to melt all of the ice sheets suddenly; there is time for mitigation and adaptation. Source: Brown (2018) Geographical Sciences Committee of the National Academies https://www.youtube.com/watch?v=91rLXoqreic&t=460s
How is the U.S. Responding? After a 10% decline (2005-2015) in CO2, the U.S. bounced back with an increase of 3.4% in 2018. Economy-Wide Energy-Related CO2 Emissions (million metric tons) Update from Rhodium Group: 3.6% increase ~5,600 3.4% increase ~5,300 2016 2017 2018 Notable increases in emissions from natural gas, trucks, and air travel. Source for updates: https://tinyurl.com/yb8ekn8d
U.S. CO2 Emissions are Far Off Track for Global Climate Goals Forecast: fossil fuel reliance persists. Sources: EIA, Annual Energy Outlook 2019. https://tinyurl.com/E-Outlook-2019
How can the U.S. Transition to Clean Energy W/out a Price on CO2?
The U.S. Fuel Mix is Evolving Natural gas is expected to grow the most, but solar and wind are also on the rise. Coal & nuclear decline slightly. Energy Consumption by Fuel (in quads) Source: EIA, Annual Energy Outlook 2018
The U.S. Will Soon be a Net Energy Exporter (First Time Since 1953) Year the U.S. becomes a net exporter: 2019 Forecast = 2020* 2018 Forecast = 2022 2017 Forecast = 2026 Net Energy Imports (in Quads) It is particularly difficult to reset the U.S. energy system, at a time when fossil fuels are so abundant and cheap. Sources: EIA, Annual Energy Outlook 2019*, 2018 and 2017
U.S. Liquified Natural Gas (LNG) is Fueling Asia • U.S. natural gas trade was historically from Canada and to Mexico by pipeline. • It will soon be dominated by liquid natural gas (LNG) shipped in tankers to distant ports. • How “long” is the natural gas “bridge” to clean energy?
In Clean Energy, the Power Sector is Leading the Way CO2 intensity by end-use sector (Metric tons of CO2/GBtu) in 2018 U.S. CO2 intensity is declining … especially in the electric power sector. Sources: EIA, Annual Energy Outlook 2019
Electricity Systems Offer Low-Cost CO2 Reduction Potential “Abatement” costs in electricity generation are consistently cheaper and easier than in: • most end use (housing, transport) or • intermediate sectors (industry, freight, agriculture) Electricity = 35% of U.S. CO2 emissions Source: IPCC, 2014
Energy Efficiency is the Least-Cost Energy Resource in the U.S. Levelized Cost of New Electricity Resources ($/MWh) Source: Brown, et al. (2019) “The Economic and Environmental Performance of Biomass Power as an Intermediate Resource for Power Production,” Utilities Policy, 58: 52-62. https://authors.elsevier.com/a/1YzH53Peo9VR76
Carbon Pricing is Gaining Traction: (1) Carbon Dividends Plan A Carbon Tax with Revenues Recycled to Households “I really don’t know the extent to which it is man-made, and I don’t think anybody can tell you with certainty that it’s all man-made, … the risk is sufficiently strong that we need an insurance policy and this is a damn good insurance policy.” James Baker, February, 2017
Carbon Pricing is Gaining Traction: (2) Green New Deal Equivalent to ~ $60/tCO2 carbon tax . Cost of transitioning the grid into 100% renewables ~ $700 billion to $1 trillion annually. Will create new jobs and infrastructures. One way to collect the required revenue is to collect carbon taxes. Introduced by Rep. Alexandria Ocasio Cortez (of NY) and Senator Ed Markey (of Mass). The idea is to transition to 100% renewables by 2030.
most least-cost utility modeling tools are not able to adequately represent energy efficiency. As a result, some studies have ignored energy efficiency entirely when examining CO2 mitigation options (Peters and Hertel, 2016). Others simply assume an exogenous reduction of energy demand, associated with a step-curve of costs possessing little granularity. Such short cuts are necessary when modeling platforms do not compete energy supply and demand resource options, as is the case with the Integrated Planning Model (IPM) used by EPA (2015a), MJ Bradley & Associates (2016), and the Bipartisan Policy Center (BPC, 2016), the Haiku model used by Resources for the Future (RFF, 2016), US-REGEN used by the Electric Power Research Institute (EPRI, 2016), FACETS-ELC used by Wright and Kunudia (2016), and the MARketALlocation (MARKAL) model used by Shearer, et al. (2014). While the IPM used by EPA borrows forecasts of peak load and regional electricity consumption from the EIA’s National Energy Modeling System (NEMS), the IPM possesses none of the detailed level of demand-side energy modeling offered by NEMS. After applying an exogenous electricity load forecast, the power sector and its fuel supplies are then modeled. The Modeling of Energy Efficiency Policies is Often Flawed • Most modeling platforms do not compete energy supply and demand resource options • Integrated Planning Model (IPM) used by EPA (2015) • the Haiku model used by Resources for the Future • US-REGEN used by the Electric Power Research Institute • FACETS-ELC used by Wright and Kunudia (2016) • MARketALlocation (MARKAL) • They assume an exogenous reduction of energy demand. • The National Energy Modeling System (NEMS) treats EE as endogeneous. • Source: Marilyn A. Brown, et al. 2017. “Exploring the Impact of Energy Efficiency as a Carbon Mitigation Strategy in the U.S.” Energy Policy, 109: 249-259.
Energy Efficiency Involves Purchase and Usage Behaviors • Energy Efficiency Improvement – Increasing the services provided per unit of energy consumed. e.g., avoiding ubiquitous lights & space conditioning. Solid State Compact Fluorescent Incandescent
Carbon Taxes with Energy Efficiency Can Achieve Deep Decarbonization at Low Cost Current policies would lead to 54 GT CO2 in the U.S. electric sector from 2016-2040. A $10 tax/ton of CO2 with strong energy efficiency could reduce this to 44 GT CO2. • Source: Brown, M. A., & Li, Y. (2018). Carbon pricing and energy efficiency: pathways to deep decarbonization of the US electric sector. Energy Efficiency, 12(2), 463-481, https://doi.org/10.1007/s12053-018-9686-9.
Household Dividends Reduce Energy Burdens Electricity demand reduction In Billion kWh Electricity bills & carbon tax revenues $20 Tax $20 Tax + EE Low price elasticity Low price elasticity $20 Tax $20 Tax + EE • A $25 carbon tax would cut CO2 emissions significantly (from 1,900 to 400 million tons), but would reduce electricity demand only slightly. • With EE policies, demand reduces further, especially in the residential sector (black bar above). • Adding energy efficiency coupled with a carbon tax reduce the cost of climate policy.
Measuring the Cost of Climate Policy Cost of climate policy = Utility Resource Costs Energy Efficiency Costs Carbon Tax Recycling + – (Environmental benefits > welfare losses.) Source: Brown, M. A., Kim, G., Smith, A. M., & Southworth, K. (2017). Exploring the impact of energy efficiency as a carbon mitigation strategy in the US. Energy Policy, 109, 249-259.
Impact of Carbon Pricing on Carbon Intensity: Regional Heterogeneities Our modeling of an escalating tax on CO2 ($25-108/tCO2) from electricity highlights the largely overlooked regional complexities of a uniform environmental tax.
Impact of Carbon Pricing on Carbon Intensity: Regional Heterogeneities 2050 Per capita recycling of tax revenues would transfer wealth from the South and Central states to the Northeast and West.
Impact of Carbon Recycling Scheme Household dividends from a carbon tax ($2017/household) Per capita recycling of tax revenues would transfer wealth from the South and Central states to the Northeast and West.
Impact of Carbon Recycling Scheme Household dividends from a carbon tax ($2017/household) Per capita recycling of tax revenues would transfer wealth from the South and Central states to the Northeast and West.
Current Research: G2V and V2G • Pairing storage with rooftop solar and EVs looks promising. • The technologies are known, but the business models are unclear. Consumers are becoming producers (“Prosumers”) Source: Mateo Jaramillo, Tesla, June 19, 2017
What Roles Could EVs Play? • First, they can reduce GHG emissions compared to ICEs. • And they can support the grid. • How much are these grid services worth? • What business models can be used to create value? • Source: Electricity Advisory Committee (EAC) 2018. Enhancing Grid Resilience with integrated Storage from Electricity Vehicles U.S. Department of Energy https://tinyurl.com/EAC-GridResilience
“Our Energy Destiny Lies with our Governments”—FatihBirol, IEA • “70% of all energy investments are government driven” … What are feasible policies? • Can carbon tax revenues help fund infrastructure or must they be returned to household? • A deep understanding of consumers, markets and policies is needed – a socio-economic technical perspective.
The International Domain of Policy and Innovation • Domestic demand-pull & technology-push policies impact domestic lighting patenting. • Domestic demand-pull energy-efficiency policy also stimulates foreign energy-efficiency inventive activity. • If we only look at the effect of domestic energy policy on domestic innovation, we underestimate energy policies’ overall influence. • Source: Yeong Jae Kim and Marilyn A. Brown. (2019) “Impact of Energy-Efficiency Policies on Innovation: The Case of Lighting Technologies.”Energy Policy, 128, 539-552.
Conclusions • As the U.S. energy economy booms, now is the time to invest in our future clean energy system. • Carbon needs to be priced, and stronger energy-efficiency policies would help constrain costs. • The current Administration’s “dial back” of U.S. clean energy policies has been characterized by some as a return to the stone age, but the momentum of renewables will ultimately prevail. • Wise recycling and investment of carbon tax revenues can be a powerful positive force. • In sum, policy design matters!
For More Information —and some late night reading?? Dr. Marilyn A. Brown, Regents’ and Brook Byers Professor of SustainableSystems School of Public Policy Georgia Institute of Technology Atlanta, GA 30332-0345 Marilyn.Brown@pubpolicy.gatech.edu Climate and Energy Policy Lab: www.cepl.gatech.edu 2019 2016 2015 2013