Download
1 / 42
420 likes | 446 Views
Explore cross-spectral measurement techniques and designs for accelerating axion cavity searches. Learn about cross-correlation principles, resolution enhancement in thermal cavity noise spectra, and low/high frequency cavity-based searches. Discover the rejection of uncorrelated noise with cross-correlation measurements and how to improve resolution in intrinsic cavity noise. Gain insights on cross-spectrum rejection and the benefits of combining cavity outputs. Dive into axion detection methods and the significance of cavity quality factors. Master the art of measuring system noise, improving SNR, and optimizing measurement setups for enhanced sensitivity. Excel in axion haloscope experiments and delve into the world of cavity resonators. Elevate your understanding of cavity noise mitigation and maximize the potential of your axion cavity search endeavors.

E N D
Faculty of science Cross-spectral measurement techniques for axion cavity searches stephenparkeR Workshop on Microwave Cavity Design for Axion Detection August 26th, 2015 Lawrence Livermore National Laboratory, USA
Outline • Fundamental principles of cross-correlation • Improving the resolution of thermal cavity noise spectrums with cross-correlation measurements • Cross-correlating two cavities in an axion/WISP search • Low & High frequency cavity-based axion searches Stephen.Parker@uwa.edu.au
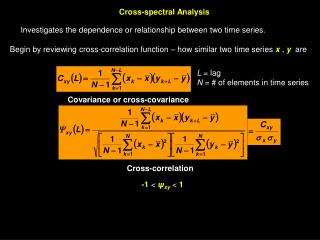
Cross-Correlation Compute the cross-spectrum of two signalsUncorrelated signals are rejected Correlated signals are retained Generally deal with white noise. Built-in function of most VSA(FFT) Or digitizer devices No additional measurement time Stephen.Parker@uwa.edu.au
Taken from arXiv:1003.0113v1 Cross-Correlation Basic Schematic <YX*> <(C+B) x (C+A)*> <CC*> + <CA*> + <BC*> + <BA*> Stephen.Parker@uwa.edu.au
Cross-correlation: rejection of uncorrelated noise Basic experiment to demonstrate how uncorrelated noise is rejected. 2 nominally identical amplifiers Inputs terminated with 50 ohm loads Outputs recorded on 2 channels of FFT in frequency range outside of flicker noise regime Single channel spectrums and cross-spectrum recorded for different averages. 2 channels – noise is rejected proportional to rt(2m). But, typically measuring some DUT, power split by rt(2) between channels Limitation: isolation between the 2 channels. Stephen.Parker@uwa.edu.au
Cross-correlation: rejection of uncorrelated noise Single channel: Mean is constant Error (std-dev) scales with rt(m) Stephen.Parker@uwa.edu.au
Cross-correlation: rejection of uncorrelated noise Single channel: Mean is constant Error (std-dev) scales with rt(m) Cross-spectrum: Mean scales with rt(2m) Error (std-dev) is constant relative to mean Stephen.Parker@uwa.edu.au
Cavity enables resonant enhancement of converted photon signal. Measure power to constrain axion-2photon coupling. The Axion Haloscope – Quick Recap & Overview Excellent sensitivity (real discovery potential) Can reveal some astrophysics Relatively cheap ρa – Axion density ma – Axion mass B0 – Magnetic field strength V – Cavity volume C – Form factor (E.B overlap) Q – Cavity quality factor (or axion Q) Stephen.Parker@uwa.edu.au
Cavity thermal noise + Amplifier noise = measurement system noise Axion haloscope primary noise contributors PSD = + Frequency Assuming low noise L.O. & mixer Stephen.Parker@uwa.edu.au
Define our SNR / “figure of merit” SNR = m = number of averages Signal / S.D. In this context, reduction of level of systematic noise functionally equivalent to reducing overall statistical measurement error Stephen.Parker@uwa.edu.au
Improving resolution of intrinsic cavity noise Initial motivation - measuring intrinsic noise of cryogenic BAW quartz resonators Stephen.Parker@uwa.edu.au
Improving resolution of intrinsic thermal cavity noise - SNR Single channel haloscope SNR = If PA1 >> PC then equivalent to single channel haloscope SNR = … no SNR benefit, but enhanced resolution of cavity noise in spectrum Stephen.Parker@uwa.edu.au
Cross-spectrum “proof-of-concept” measurement setup Sapphire-loaded copper cavity resonators Resonance at 9.3 GHz Room temperature Q of ~50,000 Thermally anchored / controlled in vacuum chamber ~60 dB gain in each channel Mixer conversion efficiency ~11 V/rt(W) L.O. = Agilent E8257C Recorded on HP89410A Stephen.Parker@uwa.edu.au
A brief detour on mixer phase difference conditions Amplitude Sensitive V R.F. L.O. Phase Sensitive I.F. Δθ “Ideal” conditions… Characterize by injecting modulated signal Thermal noise should be equally distributed between phase and amplitude So cannot “further improve” on cross-spectrum rejection by having one channel phase sensitive and the other amplitude sensitive… …Of course, always check and optimize your measurement system. Stephen.Parker@uwa.edu.au
(1000 averages) Improving resolution of intrinsic cavity noise - measurements Single channel SNR ~ 25σ Stephen.Parker@uwa.edu.au
(1000 averages) Improving resolution of intrinsic cavity noise - measurements Single channel SNR ~ 25σ Cross-spectrum SNR ~ 32σ PC ~ PA1 (single channel has not accounted for power splitting) Stephen.Parker@uwa.edu.au
Effectively combine two cavity outputs (put that rt(2) to good use) Immediate amplification allows for cavities to be well separated (test coherence length) Cross-correlating two cavities Stephen.Parker@uwa.edu.au
Relative phase of the two measurement channels shouldn’t impact the cross-spectrum Maximum sensitivity for both resonant frequencies overlapped, but in principle can work with relative detuning in the form of an effective Q-factor: Cross-correlating two cavities – relative phase & frequency f2 = f1 (1+x/2) Stephen.Parker@uwa.edu.au
Cross-correlating two cavities – SNR SNR = Rt(2) improvement due to addition of second cavity volume How does this compare to standard power-combining… Stephen.Parker@uwa.edu.au
Briefly: Power-summing cavities … SNR = N cavities Stephen.Parker@uwa.edu.au
Cross-correlating two cavities – SNR comparison For PA1 >> PC comparison reduces to N (traditional approach scales up better) For PA1 ~ PC or PC > PA1 then cross-correlation improves (assuming N = 2) Stephen.Parker@uwa.edu.au
Cross-correlating two cavities – experimental setup Same environment and setup as before Pair of nominally identical sapphire-loaded copper cavity resonators 9.3 GHz / Q ~ 50,000 Thermally anchored / controlled in vacuum chamber Frequency-tuned to overlap by adjusting temperature control set-points. Stephen.Parker@uwa.edu.au
Cross-correlating two cavities – measurements Single channel SNR = 14σ Stephen.Parker@uwa.edu.au
Cross-correlating two cavities – measurements Single channel SNR = 14σ Cross-spectrum SNR = 20σ 20 / 14 ~ rt(2) Stephen.Parker@uwa.edu.au
Cross-correlating two cavities – measurements Fit to data points: Single-channel = 0.44*rt(m) Cross-spectrum = 0.46*rt(2m) Starting SNRs are “small” (less than 1) Stephen.Parker@uwa.edu.au
Cross-spectrum wrap-up Cross-correlation can be used to: Enhance resolution of intrinsic thermal cavity noise Effectively combine two spatially well-separated cavities, with possible SNR improvements if measurement system is limited by cavity noise Can be used to scrutinize candidate signals and test coherence length Stephen.Parker@uwa.edu.au
Low and High frequency cavity axion searches What equipment do we have lying around…
Equipment – Dilution Fridges Stephen.Parker@uwa.edu.au
Magnet & readout LNF Cryo HEMTS ~10 K Noise temp (15 – 29 GHz) SQUID amps around 10 MHz 2-channel digitizer Keysight U5303A 7 T Magnet (10 cm bore) Stephen.Parker@uwa.edu.au
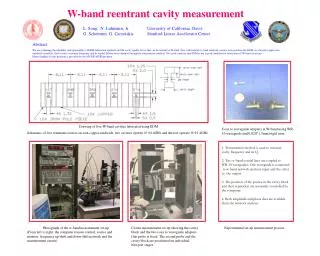
Pushing frequency lower in fixed diameter - Prototype Low frequency lumped LC 3D Cavity Applications 1) Measure RF Permittivity of Samples (MWA / SKA). 2) Low frequency Axions?? We proposed in 2013/14 Advantage: Large tuning range Lower frequency Disadvantage: Lose sensitivity ~13 cm B field E field ~40 cm Stephen.Parker@uwa.edu.au
Re entrant Vol=6.3 x 10⁻⁷ m3 Vol=6.3 x 10⁻⁵ m3
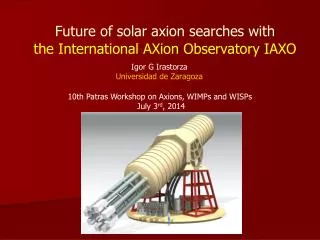
A cavity-based search for 26.6 GHz (110 μeV) CDM axions WHY? Stephen.Parker@uwa.edu.au
A cavity-based search for 26.6 GHz (110 μeV) CDM axions Claim that multiple J-J experiments observe anomalous Shapiro steps that are consistent with being caused by axions with mass Ma = 110 +/- 2 μeV. Should be checked via independent dedicated experiment. Relatively narrow mass-range means cavities could be appropriate method. BUT Need to check for local galactic axion density of ρa ~ 0.05 GeV/cm3 (compared to the usual assumption of ~ 0.45 GeV/cm3) Can we push ahead with this right now? Stephen.Parker@uwa.edu.au
Big problems with standard approach: loss of cavity volume, increased amplifier noise or other amplifier problems Higher frequency cavity-based axion searches Brute force solution: Compensate for loss in volume at high frequencies by looking at multiple frequencies simultaneously. Alternative to power-summing at one frequency and dealing with keeping all the cavities frequency-tuned / locked We’ll need an acronym or two… Stephen.Parker@uwa.edu.au
micrOwave Resonator Group Axion coNvertor O.R.G.A.N. ORGAN PIPE micrOwave Resonator Group Axion coNvertor PathfInder ProjEct Start with 1 cavity… Stephen.Parker@uwa.edu.au
TM0x0 mode family provides best overlap for E.B Note that product of form factor * volume is ~constant for TM0x0 modes for a set frequency Cylindrical Copper Cavities C * V (fractional, relative to TM010) For TM020, a 2cm diameter gives 26.6 GHz TM0x0 Stephen.Parker@uwa.edu.au
Cavity Tuning To check the full error range of 26.6 GHz signal, need ~4% frequency tuning 26.1 – 27.1 GHz Want a simple tuning solution that can be implemented on a physically small cavity in cryogenic environment. Stephen.Parker@uwa.edu.au
Cavity Tuning – “Squiggle” motor 20 mm travel Stephen.Parker@uwa.edu.au
Unperturbed TM020 ~ 0.13 Cavity Tuning - COMSOL C Post position (mm) Frequency GHz (TM020) Post position (mm) Stephen.Parker@uwa.edu.au
Oxidisation due to slight coldhead helium leak Cryogenic system – quick show & tell Stephen.Parker@uwa.edu.au
Cross-spectrum techniques can be used to enhance intrinsic cavity noise measurements or “combine” 2 spatially well-separated cavities • Reentrant cavity to drop frequency for fixed diameter • Experiment under construction to check claim of axion signal at 110 μeV (26.6GHz). • Possible future expansion to look over wider mass range. Summary Acknowledgements Ben McAllister, Daniel Creedon, Ken Foo, Eugene Ivanov & Michael Tobar Stephen.Parker@uwa.edu.au