STATISTICS FOR BUSINESS
240 likes | 259 Views
Learn about Statistical Process Control (SPC) and its applications in various industries like manufacturing and services. Discover how attributes and variables of units are analyzed to ensure processes are performing as expected. Understand the types of variations that can occur in a process and how to detect and rectify them using SPC methods.

STATISTICS FOR BUSINESS
E N D
Presentation Transcript
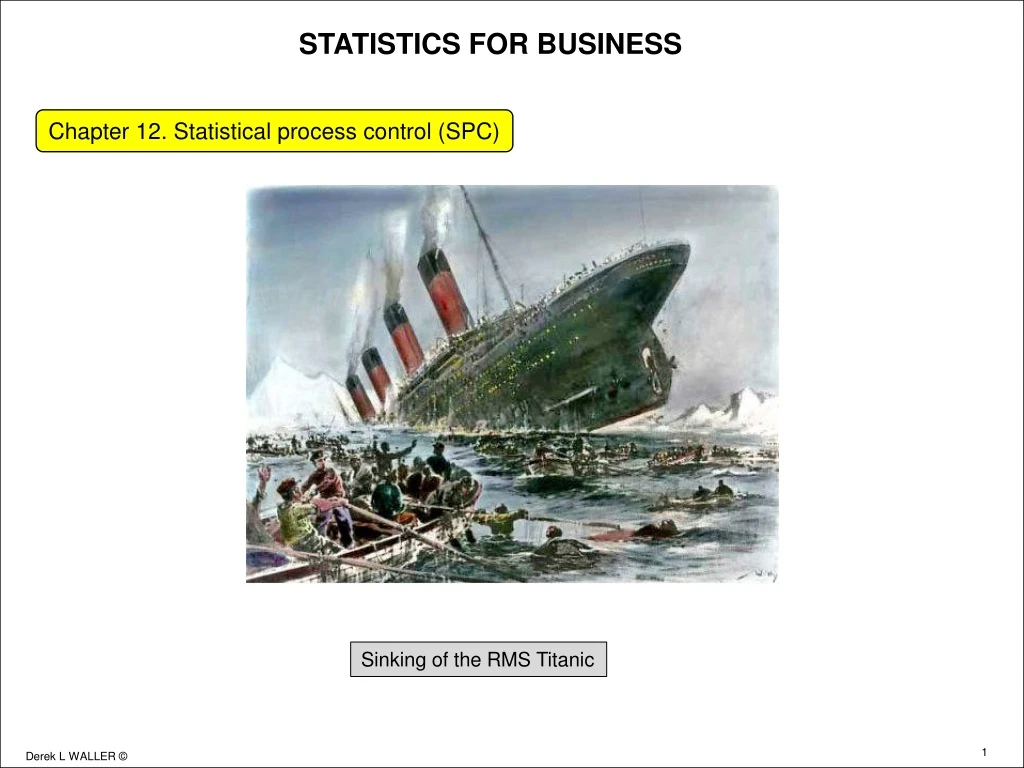
STATISTICS FOR BUSINESS Chapter 12. Statistical process control (SPC) Sinking of the RMS Titanic
STATISTICS FOR BUSINESS (Statistical process control) Sinking of the RMS Titanic Statistical process control Using statistical methods to verify “process” is performing as expected, or according to specifications The process, is the way something is done…... • Sampling is made of the “product” over a suitable time period. • If “product” conforms, conclusion is that the way it is done, made, or produced, then process, is correct. • If not conclusion is that the process is not performing as expected The process is the assurance given by the certification of ISO-9001 SPC is one of the chapters in the ISO-9001
STATISTICS FOR BUSINESS (Statistical process control) Sinking of the RMS Titanic SPC applies to any business area MANUFACTURING Drilling • Labeling • Stamping • Turning • Molding • Milling • Cutting • etc SERVICES Arrival time (transport)• Absenteeism • Service level • (hotels) Errors (accounting) • Teaching quality • etc • Periodically sampling of tangible product or activity are analyzed • Situation acceptable. No action • Units do not conform. Process is out of control • .Process is stopped and anomalies corrected • Purpose of SPC is verification that process is performing correctly • It gives assurance that product is correct. • SPC does not guarantee quality of product. Only the process
STATISTICS FOR BUSINESS (Statistical process control) Sinking of the RMS Titanic Quality characteristics of units - Attributes ATTRIBUTES Yes, or no • Pass, or fail • Open, or closed • Go, or no-go • Defective, or non-defective • On, or off • Works, does not work • Late, or on-time • Present, or absent • Good or bad • Fresh or not fresh, • etc Attributes are count data 6 of the sample batteries were defective • 3 of the hotel rooms did not conform • 5 of the bills were incorrect • 4 of the meals were cold • 9 of the ceramic plates had cracks….. • Discrete distribution is basis for statistical inference • Binomial • Poisson
STATISTICS FOR BUSINESS (Statistical process control) Sinking of the RMS Titanic Quality characteristics of units - Variables Characteristics measured on a continuous scale such that there is a range of acceptance • Time to make hamburger is 4.0 min ± 30 sec • Operator takes 5.0 minutes • Not acceptable • Perhaps further training required • Weight of coffee in jar is 200 g ± 4 g • Sample weighs 201 g – acceptable • Sample weighs 206 g – excessive costs • Sample weighs 192 g – cheating customer • Time to clean a room is 15 minutes ± 2 min • Actual time was 20 minutes • Understand why • This can increase total cost Normal distributions used as basis for statistical inference
STATISTICS FOR BUSINESS (Statistical process control) Sinking of the RMS Titanic Types of variation in a process: Consider services RANDOM VARIATION (common , or inherent) Teaching • Hotel and food services • Airline transport • Distribution • Retail sales Service level good but slight daily variations: Not unusual when people involved. ASSIGNABLE (or systematic) VARIATION Teaching – classes sometimes poor • Hotel and food services– quality not always good • Airline transport – planes are late • Distribution – orders not always correct • Retail sales – stock outs occur Why? Operation needs to be analyzed and rectified Purpose of SPC is to detect assignable variations If these are present, process is not acceptable or bluntly out-of-control
STATISTICS FOR BUSINESS (Statistical process control) Sinking of the RMS Titanic A process operates over time A filling operation for a target level of 33 cl Here process is in control
STATISTICS FOR BUSINESS (Statistical process control) Sinking of the RMS Titanic Process out-of-control: Average volume has changed
STATISTICS FOR BUSINESS (Statistical process control) Sinking of the RMS Titanic Process out-of-control: Distribution has changed
STATISTICS FOR BUSINESS (Statistical process control) Sinking of the RMS Titanic Process out-of-control: Distribution profile over time has changed • In services: • Cleaning rooms • Cooking meal • Teaching • Distribution:
STATISTICS FOR BUSINESS (Statistical process control) Sinking of the RMS Titanic Procedure for SPC: Elements of control are the same whether controlling Quality • Revenue • Costs • Productivity • Customer service • etc. 1. Define characteristics to be measured Weight (chocolate bars) •Volume (cans of beer) •Color (paper) •Viscosity (salad dressing) • Lateness (airplanes) • Errors (accounting) • Service level (restaurant) • Hotel revenues • 2. Establish upper and lower limits of measurement for control chart • These are specifications and benchmarks. • Measurements outside of these indicates process is out-of-control 3 Measure the variable characteristic 4. Take corrective action if variable not within specification Adjust machines • Retrain staff • Replace staff • Replace equipment
STATISTICS FOR BUSINESS (Statistical process control) Sinking of the RMS Titanic Essentially three types of SPC charts. p-chart (percentage, or proportion): Measures fraction, or percentage defective units in sample c-chart (count chart): Measures number of defective units in sample x-bar chart: Measures sample average together with Range chart: Measures sample range In charts there are three benchmarks: Centre line (CL) Upper control limit (UCL) Lower control limit (LCL) When limits established they are benchmarks for comparison
STATISTICS FOR BUSINESS (Statistical process control) Sinking of the RMS Titanic p-chart (proportion or percentage chart) • Measures discrete data • Binomial distribution correct probability function • Large sample sizes, normal distribution may be used • Upper control limit: UCL = p + z*sp • Lower control limit: LCL = p - z*sp • p is target fraction, or percent, according to specification • If there is no target fraction then use average (p-bar) of sample
STATISTICS FOR BUSINESS (Statistical process control) Sinking of the RMS Titanic c-chart (count chart): c is the number of defects. • Used when counting number of errors is more meaningful than percentage, or fraction • No spelling errors on one page of typeset, or webpage • N° blemishes on one square meter of fabric • N° imperfections on one square meter of white paper Mean no. of defects (center line) is Standard deviation is Upper control limit Lower control limit • c-bar is average of sample data • A target value of c might be used Poisson distribution (with variation equal to mean) basis for developing c-charts
STATISTICS FOR BUSINESS (Statistical process control) Sinking of the RMS Titanic Control charts for variables. Variables are characteristics that take on a range of values Volume (liters) • Area (m2) • Time (hr) ) • Speed (km/hr) • Length (meters) • Weight (kg) • Sound (decibels) Samples drawn from population described by: Sample mean x-bar; Sample range R x-bar chart and range chart must be used together to monitor product quality. Why? • Producer purchases sacks of sugar from a local supplier. Weight of each sack specified as 25 kg. • From a lot, a sample of 10 sacks is selected at random, and weighed • Weights: 21; 27; 24; 28; 23; 25; 29; 22; 25; 26 kg • Average weight is 25 kg. However range is 8 kg (29 -21) or 32% of average (8/25). Too high Using both average and range charts monitors average value and dispersion
STATISTICS FOR BUSINESS (Statistical process control) Sinking of the RMS Titanic Control charts for variables. X-bar chart, control limits If standard deviation unknown, or difficult to determine it can be replaced by average range Alternatively: Sample range control charts developed by Bell Telephone Labs of AT&T A, B, and C are empirical values and a function of sample size
STATISTICS FOR BUSINESS (Statistical process control) Sinking of the RMS Titanic Control limits related to Normal distribution
STATISTICS FOR BUSINESS (Statistical process control) Sinking of the RMS Titanic Control limits Just because all observations are within limits is no guarantee that assignable variations are not present Just because an observation falls outside a control limit, no guarantee that assignable variables are present When only random variations present: With 1-s limits: 68.3% of sample means inside; 31.7% of sample means outside With 2-s limits: 95.5% of sample means inside; 4.5% of sample means outside With 3-s limits: 99.7% of sample means inside; 0.3% of sample means outside • Using wider limits (3-s) • Reduces risk of concluding process is out-of-control when actually only random variables • account for data outside control limits • However makes it more difficult to detect assignable (non-random) variations when they are present
STATISTICS FOR BUSINESS (Statistical process control) Sinking of the RMS Titanic Taguchi criteria and control limits • Small standard deviation • Curve is slender – leptokurtic • Peak is sharp Target distribution for six-sigma Poor specification limits Better specification limits Best specification limits • An intermediate standard deviation • Curve is mesokurtic • Peak is neither sharp nor flat Inappropriate for six-sigma • Large standard deviation • Curve is broad– platykurtic • Peak is flat • Very inappropriate distribution for six-sigma
STATISTICS FOR BUSINESS (Statistical process control) Sinking of the RMS Titanic Example of control charts Sample means lie close or hug center line. In control
STATISTICS FOR BUSINESS (Statistical process control) Sinking of the RMS Titanic Example of control charts Sample means within limits but wide fluctuations
STATISTICS FOR BUSINESS (Statistical process control) Sinking of the RMS Titanic Example of control charts Sample means within limits but disturbing trend
STATISTICS FOR BUSINESS (Statistical process control) Sinking of the RMS Titanic Example of control charts Sample means within limits but an abrupt change
STATISTICS FOR BUSINESS (Statistical process control) Sinking of the RMS Titanic Example of control charts Sample means beyond upper limit: out-of-control