Download
1 / 28
280 likes | 332 Views
Learn about glucose regulation in all cells, impact of insulin and glucagon, and mechanisms of Type I and Type II diabetes mellitus. Explore diagnosis, symptoms, and complications of diabetes.

E N D
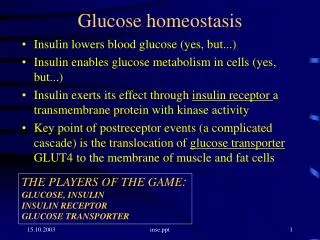
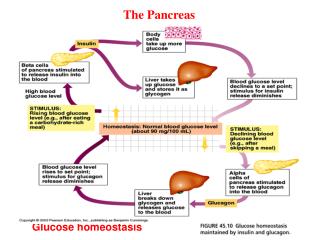
Glucose homeostasis All cells in the body use glucose as energy source to make ATP Blood glucose feedbacks to pancreas: high blood glucose insulin- promotes uptake of glucose, conversion of glucose to glycogen (glycogenesis), to pyruvic acid (glycolysis), suppresses gluconeogenesis. Also promotes nucleic acid, fatty acid and protein synthesis. Net effect of reducing blood glucose. (cf cortisol) low blood glucose glucagon- stimulates glucose production (glygenolysis, gluconeogenesis) and secretion, fat breakdown. Net effect of increasing blood glucose. (cf to adrenaline)
The stress/exercise hormones:cortisol, adrenaline, noradrenaline cortisol- increases gluconeogenesis, glycogenesis, fat breakdown adrenaline- increases glucose uptake, glycogenolysis, fat breakdown noradrenaline- increases glucose uptake, glycogenolysis, fat breakdown
Diabetes Mellitus Heterogeneous syndrome (many features, sliding scale of severity) in which the central feature is a chronic elevation of blood glucose (hyperglycemia) This leads to long term tissue damage, especially of blood vessels, nerves, heart, kidney and eyes Due to insulin deficiency or insulin resistance. However, there are many causes of both deficiency and resistance
Diabetes Mellitus Chronic disorder of protein, fat and carbohydrate metabolism
Type I diabetes mellitus(insulin dependent diabetes mellitus IDDM) • Destruction of pancreatic beta cells by autoimmune process [Beta cells produce insulin in response to high glucose levels] • Autoimmune trigger (virus?) and genetic predisposition (major histocompatability complex) • Hyperglycemia occurs when about 75% of beta cells destroyed (tolerance of system) • Low or absent insulin secretion • Early onset (childhood) • Treated with insulin injections
Type II diabetes mellitus(non-insulin dependent diabetes mellitus NIDDM) • Multifactoral interaction of genetics, environment and age • Inability to respond to insulin-receptor or post-receptor defects • Insulin hypersecretion in response to high glucose, eventual failure of beta cell secretion • Insulin resistance • Late onset • Often gradual onset with chronic mild hyperglycemia • Obese and non-obese types • Endothelial cell dysfunction • Leptin physiology dysfuntion
Other specific types of diabetes mellitus • Genetic defects of beta cells (MODY) • Genetic defects of insulin signalling • Diseases of the pancreas • Endocrinopathies • Gestational
Clinical diagnosis and symptoms Normal homeostatic mechanisms maintain blood glucose levels within the range 3.5-6.5 mmol/L Diabetes (these figures occasionally change...) random blood glucose 11.1mmol/l fasting (no food for 8h) blood glucose 7.0mmol/l oral glucose tolerance test (OGTT) 2h 11.1mmol/l Classical symptoms also include: polyuria (excessive urination), polydipsia (thirst), nocturia (nocturnal urination), lethargy, weight loss
Oral glucose tolerance test Glucose tolerance curve for a normal person and one with insulin-dependent diabetes mellitus (IDDM, Type 1 diabetes). The dotted lines indicate the range of glucose concentration expected in a normal individual.
Impaired glucose tolerance • Intermediate category • Hyperglycemia at fasting and after OGTT but not in diabetic range • Higher risk of developing type II diabetes
Mechanism • Loss of insulin effects on main targets of action (liver, muscles, fat cells): • promotes uptake of glucose, conversion of glucose to glycogen (glycogenesis), to pyruvic acid (glycolysis), suppresses gluconeogenesis. Also promotes synthesis of nucleic acid, fatty acids and protein. Net effect of reducing blood glucose • Hypothesized increase in glucagon secretion and activity: • stimulates glucose production (glygenolysis, gluconeogenesis) and secretion, fat breakdown. Net effect of increasing blood glucose
Mechanism • Direct effects of increased levels of glucose: • while liver, muscles and fat require insulin for glucose uptake, blood vessels, nerves, kidney and the eye lens do not require insulin • Thus, increased intracellular levels of glucose in these cells causes: • non-enzymatic glycation (glucose binds to proteins) = AGEs (advanced glycosylation end products) • oxidative-reductive stress (more free-radicals produced) • increased polyol pathway activity (sorbitol & fructose accumulates in cells) → ion pump/osmolality dysfunction • intracellular myo-inositol depletion (serves as a • “compatible osmolyte” used to control intracellular osmolarity) • increased protein kinase C activity, due to increased glycolytic activity
Mechanism • increased blood pressure • increased blood viscosity & coagubility • endothelial cell dysfunction • thickening of basement membranes
Insulin and insulin receptors Insulin : two peptide chains, A and B, linked by two disulphide bridges www.chemicalgraphics.com/ paul/vrml2pov/ Insulin receptor: two alpha subunits and two beta subunits linked by disulfide bonds arbl.cvmbs.colostate.edu/..../insulin_phys.html
insulin-receptor events • The insulin receptor is a tyrosine kinase. • = an enzyme that transfers phosphate groups from ATP to tyrosine residues on intracellular target proteins. • Binding of insulin to receptor causes autophosphorylation, which activates the catalytic activity of the receptor • The activated receptor then phosphorylates a number of intracellular proteins, which either activates or inactivates them • Several intracellular proteins have been identified as phosphorylation substrates for the insulin receptor • e.g. insulin receptor substrate 1 (IRS-1) • IRS-1 serves as a type of docking center for recruitment and activation of other enzymes
PC A C G Ph K P P Ca2+ Inactive Semi-active Active Glucagon Epinephrine / adrenalin PLC G PKA DAG Ca2+ Ph K IP3 cAMP PP1 Ca2+ Ph K Endoplasmic Reticulum Ca2+ PKA PP1 PP1 Gly Ph Ph K Ph K Ca2+ PP1 P P P P Gly Ph Gly Ph [Glucose] Glycogenolysis AC Adenylate Cyclase G G Protein Gly Ph Glycogen Phosphorylase PLC Phospholipase C PKA Protein Kinase A PP1 Protein Phosphatase-1 DAG Diacylglycerol Ph K Glycogen Phosphorylase Kinase IP3 Inositol 1,4,5-triphosphate PC Phosphatidylcholine (PC)
Insulin signalling pathways • inactivation of key regulatory enzymes of glycogenolysis (glycogen → glucose) and gluconeogenesis (pyruvate → glucose) • activation of key regulatory enzymes of glycolysis (glucose → pyruvate) and glycogenesis (glucose → glycogen) • glycogen → fatty acids • amino acids uptake • protein synthesis
Insulin signalling pathways http://www.sanger.ac.uk/PostGenomics/signaltransduction/insulin/pathways/ir_itinerary
adrenaline diminishes insulin secretion by beta cells and counters the effects of insulin in liver and fat cells similar to glucagon via alpha- and beta-adrenergic receptors
Liver and diabetes mellitus Growing evidence that diabetes causes liver disease but difficult to distinguish cause and effect. However, studies show diabetics have double the risk of having liver disease compared with controls e.g. hepatitis C non-alcoholic fatty liver disease (NAFLD) and non-alcoholic steatohepatitis (NASH) cirrhosis hepatocellular carcinoma (HCC)
Hepatitis C • hepatitis C virus can induce hepatic intracellular fat (triglycerides) accumulation (steatosis) • this causes defects in insulin signalling and impairs the ability of insulin to suppress hepatic glucose production • the hepatitis C core protein can disrupt the IRS-1 signalling pathway (increases glucose uptake in muscle, but not liver -IRS-2....)
non-alcoholic fatty liver disease (NAFLD) and non-alcoholic steatohepatitis (NASH) • insulin resistance → high circulating insulin • leading to defective fatty acid oxidation in mitochondria • resulting in intracytoplasmic accumulation of triglycerides • accumulated fat induces inflammatory and fibrotic response • elevated serum aminotransferase activity
Cirrhosis definition: damage to liver cells which leads to impaired structure and function due to: fibrosis (scarring) altered blood and bile flow- constriction of vessels and ducts leading to build-up and overflow, cholestasis (build-up of bile in liver)
Hepatocellular carcinoma (HCC) • as consequence of insulin resistance → NAFLD → NASH → cirrhosis → HCC • or • direct stimulatory effects of insulin on hepatocyte growth leading to abnormal and uncontrolled cell growth (neoplasia)