Download
1 / 49
490 likes | 508 Views
Explore the concepts of supply and demand, market equilibrium, competition, and the factors that influence buyers and sellers in a market economy.

E N D
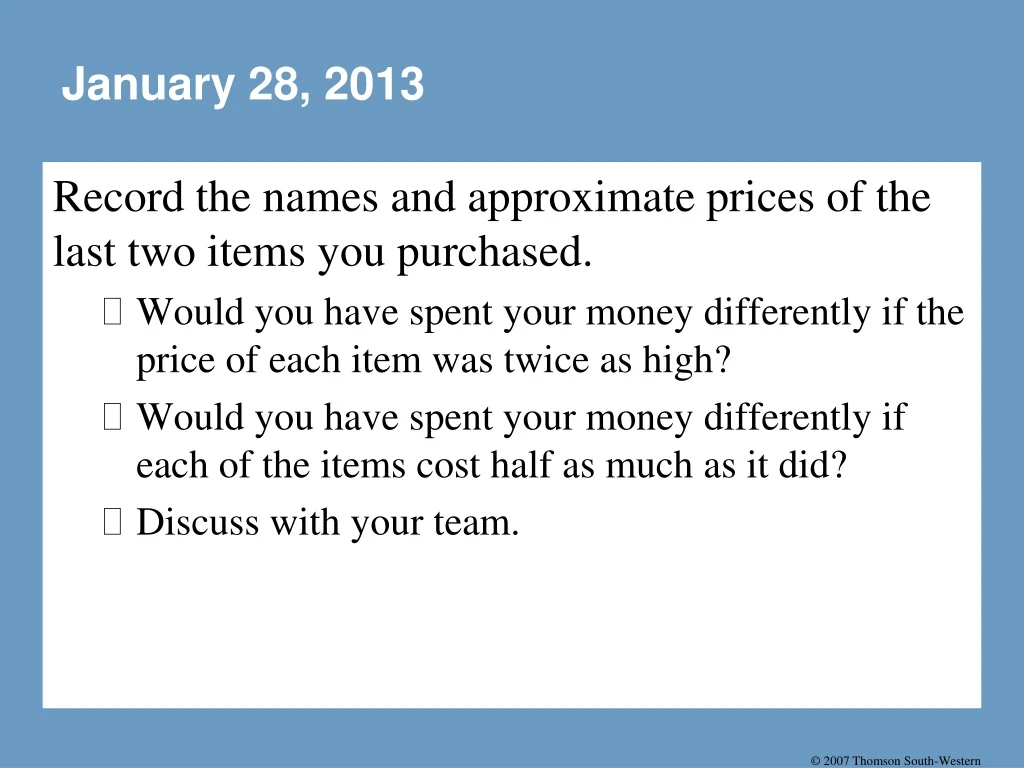
January 28, 2013 Record the names and approximate prices of the last two items you purchased. • Would you have spent your money differently if the price of each item was twice as high? • Would you have spent your money differently if each of the items cost half as much as it did? • Discuss with your team.
MARKETS AND COMPETITION • Supply and demand are the two words that economists use most often. • Supply and demand are the forces that make market economies work. • Modern microeconomics is about supply, demand, and market equilibrium.
What Is a Market? • A marketis a group of buyers and sellers of a particular good or service. • The terms supply and demand refer to the behavior of people . . . as they interact with one another in markets.
What Is a Market? • Buyers determine demand. • Sellers determine supply.
What Is Competition? • A competitive market is a market in which there are many buyers and sellers so that each has a negligible impact on the market price.
What Is Competition? • Competition: Perfect and Otherwise • Perfect Competition • Products are the same • Numerous buyers and sellers so that each has no influence over price • Buyers and Sellers are price takers • Monopoly • One seller, and seller controls price
What Is Competition? • Competition: Perfect and Otherwise • Oligopoly • Few sellers • Not always aggressive competition • Monopolistic Competition • Many sellers • Slightly differentiated products • Each seller may set price for its own product
Entrepreneurial Thinking • Three of the most common types of entrepreneurs are inventors, innovators & marketers. • Work with your team to create a grid similar to the one below: Existing ProductNew Product Invention Innovation Marketing
DEMAND • Quantitydemanded is the amount of a good that buyers are willing and able to purchase. • Law of Demand • The law of demand states that, other things equal, the quantity demanded of a good falls when the price of the good rises.
The Demand Curve: The Relationship between Price and Quantity Demanded • Demand Schedule • The demand schedule is a table that shows the relationship between the price of the good and the quantity demanded.
The Demand Curve: The Relationship between Price and Quantity Demanded • Demand Curve • The demand curve is a graph of the relationship between the price of a good and the quantity demanded.
1. A decrease in price ... 2. ... increases quantity of cones demanded. Figure 1 Catherine’s Demand Schedule and Demand Curve Price of Ice-Cream Cone $3.00 2.50 2.00 1.50 1.00 0.50 Quantity of 0 1 2 3 4 5 6 7 8 9 10 11 12 Ice-Cream Cones
Shifts in the Demand Curve • Change in Quantity Demanded • Movement along the demand curve. • Caused by a change in the price of the product.
B $2.00 4 Changes in Quantity Demanded A tax on sellers of ice-cream cones raises the price of ice-cream cones and results in a movement along the demand curve. Price of Ice-Cream Cones A 1.00 D 0 8 Quantity of Ice-Cream Cones
Shifts in the Demand Curve • Consumer income • Prices of related goods • Tastes • Expectations • Number of buyers
Shifts in the Demand Curve • Change in Demand • A shift in the demand curve, either to the left or right. • Caused by any change that alters the quantity demanded at every price.
Increase in demand Decrease in demand Demand curve, D 2 Demand curve, D 1 Demand curve, D 3 Figure 3 Shifts in the Demand Curve Price of Ice-Cream Cone Quantity of 0 Ice-Cream Cones
Shifts in the Demand Curve • Consumer Income • As income increases the demand for a normal good will increase. • As income increases the demand for an inferior good will decrease.
Consumer Income Normal Good Price of Ice-Cream Cone $3.00 An increase in income... 2.50 Increase in demand 2.00 1.50 1.00 0.50 D2 D1 Quantity of Ice-Cream Cones 0 1 2 3 4 5 6 7 8 9 10 11 12
Consumer Income Inferior Good Price of Ice-Cream Cone $3.00 2.50 An increase in income... 2.00 Decrease in demand 1.50 1.00 0.50 D2 D1 Quantity of Ice-Cream Cones 0 1 2 3 4 5 6 7 8 9 10 11 12
Shifts in the Demand Curve • Prices of Related Goods • When a fall in the price of one good reduces the demand for another good, the two goods are called substitutes. • When a fall in the price of one good increases the demand for another good, the two goods are called complements.
SUPPLY • Quantity suppliedis the amount of a good that sellers are willing and able to sell. • Law of Supply • The law of supply states that, other things equal, the quantity supplied of a good rises when the price of the good rises.
The Supply Curve: The Relationship between Price and Quantity Supplied • Supply Schedule • The supply schedule is a table that shows the relationship between the price of the good and the quantity supplied.
The Supply Curve: The Relationship between Price and Quantity Supplied • Supply Curve • The supply curve is the graph of the relationship between the price of a good and the quantity supplied.
1. An increase in price ... 2. ... increases quantity of cones supplied. Figure 5 Ben’s Supply Schedule and Supply Curve Price of Ice-Cream Cone $3.00 2.50 2.00 1.50 1.00 0.50 Quantity of 0 1 2 3 4 5 6 7 8 9 10 11 12 Ice-Cream Cones
Market Supply versus Individual Supply 0 • Market supply refers to the sum of all individual supplies for all sellers of a particular good or service. • Graphically, individual supply curves are summed horizontally to obtain the market supply curve.
Shifts in the Supply Curve 0 • Input prices • Technology • Expectations • Number of sellers
Shifts in the Supply Curve 0 • Change in Quantity Supplied • Movement along the supply curve. • Caused by a change in anything that alters the quantity supplied at each price.
$3.00 0 Change in Quantity Supplied Price of Ice-Cream Cone S C A rise in the price of ice cream cones results in a movement along the supply curve. A 1.00 Quantity of Ice-Cream Cones 0 1 5
Shifts in the Supply Curve 0 • Change in Supply • A shift in the supply curve, either to the left or right. • Caused by a change in a determinant other than price.
Supply curve, S 3 Supply curve, S 1 Supply curve, S Decrease 2 in supply Increase in supply 0 Figure 7 Shifts in the Supply Curve Price of Ice-Cream Cone Quantity of 0 Ice-Cream Cones
0 Table 2: Variables That Influence Sellers
SUPPLY AND DEMAND TOGETHER • Equilibrium refers to a situation in which the price has reached the level where quantity supplied equals quantity demanded.
SUPPLY AND DEMAND TOGETHER • Equilibrium Price • The price that balances quantity supplied and quantity demanded. • On a graph, it is the price at which the supply and demand curves intersect. • Equilibrium Quantity • The quantity supplied and the quantity demanded at the equilibrium price. • On a graph it is the quantity at which the supply and demand curves intersect.
SUPPLY AND DEMAND TOGETHER Demand Schedule Supply Schedule At $2.00, the quantity demanded is equal to the quantity supplied!
Supply Equilibrium Equilibrium price $2.00 Demand Equilibrium quantity Figure 8 The Equilibrium of Supply and Demand Price of Ice-Cream Cone 0 1 2 3 4 5 6 7 8 9 10 11 12 13 Quantity of Ice-Cream Cones
Equilibrium • Surplus • When price > equilibrium price, then quantity supplied > quantity demanded. • There is excess supply or a surplus. • Suppliers will lower the price to increase sales, thereby moving toward equilibrium.
Supply Surplus $2.50 2.00 Demand 4 7 10 Quantity Quantity demanded supplied Figure 9 Markets Not in Equilibrium (a) Excess Supply Price of Ice-Cream Cone 0 Quantity of Ice-Cream Cones
Equilibrium • Shortage • When price < equilibrium price, then quantity demanded > the quantity supplied. • There is excess demand or a shortage. • Suppliers will raise the price due to too many buyers chasing too few goods, thereby moving toward equilibrium.
Supply $2.00 1.50 Shortage Demand 4 7 10 Quantity Quantity supplied demanded Figure 9 Markets Not in Equilibrium (b) Excess Demand Price of Ice-Cream Cone 0 Quantity of Ice-Cream Cones
Equilibrium • Law of supply and demand • The claim that the price of any good adjusts to bring the quantity supplied and the quantity demanded for that good into balance.
Economists use the model of supply and demand to analyze competitive markets. • In a competitive market, there are many buyers and sellers, each of whom has little or no influence on the market price.
The demand curve shows how the quantity of a good depends upon the price. • According to the law of demand, as the price of a good falls, the quantity demanded rises. Therefore, the demand curve slopes downward. • In addition to price, other determinants of how much consumers want to buy include income, the prices of complements and substitutes, tastes, expectations, and the number of buyers. • If one of these factors changes, the demand curve shifts.
The supply curve shows how the quantity of a good supplied depends upon the price. • According to the law of supply, as the price of a good rises, the quantity supplied rises. Therefore, the supply curve slopes upward. • In addition to price, other determinants of how much producers want to sell include input prices, technology, expectations, and the number of sellers. • If one of these factors changes, the supply curve shifts.
Market equilibrium is determined by the intersection of the supply and demand curves. • At the equilibrium price, the quantity demanded equals the quantity supplied. • The behavior of buyers and sellers naturally drives markets toward their equilibrium.
To analyze how any event influences a market, we use the supply-and-demand diagram to examine how the event affects the equilibrium price and quantity. • In market economics, prices are the signals that guide economic decisions and thereby allocate resources.