Download
1 / 45
470 likes | 747 Views
FUNCTION. Functions, Linear Function Equation and Quadratic Function. RELASI. There are 3 ways to state a relation : Arrow Diagram Set of Ordered pairs Cartesian Diagram Example:

E N D
FUNCTION Functions, Linear Function Equation and Quadratic Function
RELASI There are 3 ways to state a relation : • Arrow Diagram • Set of Ordered pairs • Cartesian Diagram Example: Given a set of A = {1,2,3,4,5} and set B = {pedicab, car, bike cycle, motor cycle, bemo}. The relation that relate set of A to B is “the quantity of the wheel”. Show those relations with: • Arrow Diagram • Set of Ordered pairs • Cartesian Diagram
RELASI c. Cartesian Diagram Answer: a. Arrow Diagram Y “the quantity of the wheel” 1. pedicab . pedicab • 2. • car . car 3. motor • . Motor 4. Bike cycle . Bike cycle • 5. . bemo bemo • X O 1 2 3 4 A B b. Set of ordered pairs = {(2,bike cycle), (2, motor), (3, pedicab) (3, bemo), (4, car )}
The definition of Function: FUNCTION A function f of set A to set B is a relation that match every element of A as a single to element B . . . . . . . . . . . A B f
There are few ways to state function: With arrow diagram f : D K. The symbol of function not always f. Example, un = n2 + 2n or u(n) = n2 + 2n With Cartesian diagram The set of ordered pairs In table FUNCTION
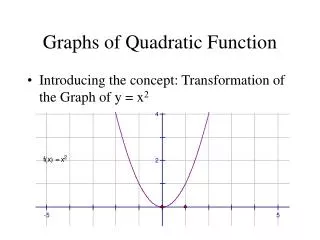
Example :function graph 4 is also called the shadow (map) of 2 and also from –2. – 2 and 2 is called pre map of 4 and symbolized by f–1(4) = 2 or – 2. Cartesian graph is a function graph of y=f(x) only if every line is parallel with Y-axis that intersecting the graph in one point only. FUNCTION Draw a graph of a function: f: x f(x) = x2 With Df = {–2, –1, 0, 1, 2}, Rf = {0, 1, 4}. Y (–2,4) (2,4) (–1,1) (1,1) X (0,0) O
Special Functions 1). Constant Function 2). Identity Function 3). Modulus Function 4). Even and Odd Function Even function if f(x) = f(x), and Odd function if f(x) = f(x) 5).Ladder Function and The Biggest Integer Value Function [[ x ] = {b | b x < b + 1, b integer number, xR} example,if2 x < 1 then [[x] = 2 6).Linear Function 7). Quadratic Function 8). Differential Function FUNCTION
Kinds of Function 1. Injective ( one by one)Function f:AB is an injective function if every two different elements in A will be mapped into two different element in B. Example: Function f(x) = 2x is one by one function and f(x) = x2 is not one by one function because f(-2) = f(2). FUNCTION 2. Surjective (Onto)Functioni f: AB then iff(A) B it is known as into function. If f(A) = B then f is a surjective function. Function f(x) = x2 it is not onto function 3. Bijective (one by one correspondence)If f: A B is injective and surjective function then “f is bijective function”
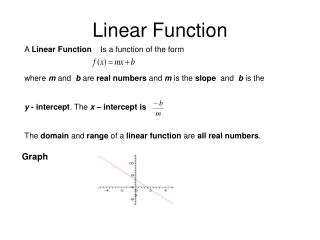
LINEAR FUNCTION 1.General Form of Linear Function This function map every x R into the form of ax + b with a ≠ 0, a and b Constanta. The graph is in straight line which is called linear function graph with the equation of y = mx + c, m is called gradient and c is Constanta 2. Linear Function Graph there are two ways to draw linear function graph: 1. by table 2. by determining the intersection points with x-axis and y-axis
LINEAR FUNCTION Example : A linear function is determine by y = 4x – 2 with the domain • Make a table of points that fulfill the equation above. • Draw the points in Cartesians diagram • Determine the intersection point of the graph with X-axis and Y-axis. {x \-1 x 2, x R}. Answer a. Take any points in the domain X -1 0 1 2 Y = 4x-2 -6 -2 2 6 Then, the function graph through these points (-1,-6), (0,-2), (1,2), (2,6)
LINEAR FUNCTION Y c. Intersection points with x-axis ( y= 0 ) y = 4x – 2 0 = 4x - 2 2 = 4x x = b. 6 • 2 • Then, the intersection points with x-axis is ( ½,0) X 1 2 O Intersection points with y-axis ( x = 0 ) y = 4x – 2 y = 4(0) – 2 y = -2 Intersection points with y-axis is (0,-2) -2 -1 • -2 • -6
LINEAR FUNCTION 3. The Gradient of Straight Line Equation How to determine gradient: (i). The equation of y = mx+c, the gradient is m. (ii). The equation of ax+by+c=0 or ax+by=-c is m= (iii). Straight line equation through two points (x1,y1) and (x2,y2), the gradient is m = • Example : • Define the gradient of the line equation below: • a. y = 3x – 4 • b. 2x – 5y = 7 • 2. Define the gradient of the line which through the points pairs of (-2,3) and (1,6)
LINEAR FUNCTION answer : 1a. Y = 3x – 4 gradient = m = 3 b. 2x - 5y = 7, a = 2 and b = - 5 m = = - 2. m = = = = 1
LINEAR FUNCTION 4. Determine the straight line equation • Line equation through a point (x1,y1) and gradient m is y – y1 = m ( x – x1 ) • Line equation through two points (x1,y1) and (x2,y2) is = Example 1 : Define the line equation that through point ( -2, 1 ) and gradient -2 Answer : y – y1 = m ( x – x1 ) y – 1 = -2 ( x – (-2)) y - 1 = -2x – 4 y = -2x - 3
LINEAR FUNCTION Example2 : Determine the line equation that through point P(-2, 3) and Q(1,4) Answer : = = = 3(y – 3) = 1(x + 2) 3y – 9 = x + 2 3y - x – 11 = 0
LINEAR FUNCTION 5. The Position of Two Straight line • Two lines are intersecting if m1 ≠ m2 • Two lines are parallel if m1 = m2 • Two lines are perpendicular if m1. m2 = -1 or m1 = - • Example : • Determine the straight line equation that through point (2,-3) and parallel with line x – 2y + 3 = 0 • Determine the straight line equation that through point (-3,5) and perpendicular to 6x – 3y – 10 = 0
LINEAR FUNCTION Answer : 1. Known the line equation x – 2y + 3 = 0 then The line equation through point (2,-3) and gradient is y – y1 = m ( x – x1) y + 3 = ½ ( x – 2 ) y + 3 = ½ x – 1 2y + 6 = x – 2 x – 2y – 8 = 0 Then the straight line equation that parallel with line x – 2y + 3 = 0 and through point (2,-3) is x – 2y – 8 = 0
LINEAR FUNCTION 2. Known the line equation 6x – 3y – 10 = 0. the straight line equation that is found through point (-3,5) and has gradient -½, then the equation is y – y1 = m(x – x1) y – 5 = -½ (x + 3) y – 5 = -½x - 2y – 10 = -x – 3 x + 2y – 10 + 3 = 0 x + 2y – 7 = 0 so, the straight line equation that through point (-3,5) and perpendicular to line 6x – 3y – 10 = 0 is x + 2y – 7 = 0.
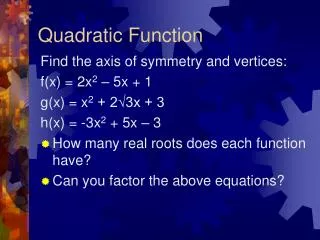
QUADRATIC FUNCTION 1. The General Form of Quadratic Function y = f(x) ax2+bx+c with a,b, c R and a 0The Graph of Quadratic Function is in the form of symmetrical parabola 2. The properties of quadratic function Graph Based on value a (i) If a > 0 (positive), then the graph will be up side. The quadratic function has extreme minimum value. It is denoted by ymin or minimum turning point (ii) if a < 0 (negative), then the graph will up side down. The quadratic function has extreme maximum value. It is denoted by ymaks or maximum turning point.
QUADRATIC FUNCTION Based on discriminant value (D) Discriminantvalue of a quadratic equation is D = b2 – 4ac The relation between D and intersection point of a graph with X-axis • If D > 0 then the graph will intersects x-axis in two different points. • If D = 0 then the graph will on the x-axis in a point. • If D < 0 then the graph will not intersect and not on the x-axis.
The Position of Quadratic Function Graph Towards x-axis (ii) (iii) X X X X (v) (vi) (iv) X (i) QUADRATIC FUNCTION a > 0 D = 0 a > 0 D < 0 a > 0 D > 0 X a < 0 D = 0 a < 0 D > 0 a < 0 D < 0
3. Drawing Quadratic Function Graph The steps to draw quadratic function graph : (i) Define the intersection point with x-axis (y = 0) (ii) Define the intersection point with y-axis Y (x = 0) (iii) Define symmetrical axis and turning coordinate The symmetrical axis equation is x = Vertex /turning coordinate is (iv) Define other points if necessary QUADRATIC FUNCTION
QUADRATIC FUNCTION Example : Draw a graph of quadratic function y = x2 – 4x – 5. Jawab : (i) The intersection point with X-axis (y = 0) x2 – 4x – 5 = 0 (x + 1)(x – 5) = 0 x = -1 or x = 5 So, the intersection point with x-axis is (-1, 0) and (5, 0). • The intersection points with axis Y (x = 0) • y = 02 – 4(0) – 5 • y = -5 • So, the intersection points with Y-axis is ( 0, -5 )
QUADRATIC FUNCTION (iii) Symmetrical axis and turning coordinate So, the symmetrical axis is x = 2 and the turning coordinate is (2, -9). (iv) Determine the helping points. For example, for x = 1, then y = -8. Then, the helping point is (1, -8).
QUADRATIC FUNCTION THE GRAPH : Y • • X -1 0 1 2 3 4 5 -1 -2 -3 -4 -5 -6 -7 -8 -9 • • • • •
QUADRATIC FUNCTION The equation of quadratic function of f(x) =ax2 + bx + c if the function graph through three points Example: Define the quadratic function that through points (1,-4), (0,-3) and (4,5) answer: f(x) = ax2 + bx + c f(1) = a(1)2 + b(1) + c = -4 a + b + c = -4 . . . 1) f(0) = a(0)2 + b(0) + c = -3 0 + 0 + c = -3 c = -3 . . . 2) f(4) = a(4)2 + b(4) + c = 5 16a + 4b + c = =5 . . . 3)
QUADRATIC FUNCTION Substitute 2) to 1) a + b – 3 = -4 a + b = -1 . . . 4) Substitute 2) to 3) 16a + 4b – 3 = 5 16a + 4b = 8 . . . 5) from 4) and 5) we have : a + b = -1 x 4 4a + 4b = -4 16a + 4b = 8 x 1 16a + 4b = 8 _ -12a = -12 a = 1 Substitute a = 1 to4) 1 + b = -1 b = -2 So, the quadratic function is f(x) = x2 -2x -3
QUADRATIC FUNCTION The equation of quadratic function of f(x) = ax2 + bx + c if there are two intersection points to X-axis and the other point is can be defined by the following formula. Example : Define the equation of quadratic function that intersects X-axis in point A (1,0), B(-3,0), and intersect Y-axis in point (0,3)
QUADRATIC FUNCTION Answer : Points (1,0) and (-3,0) is substituted to f(x) intoi : f(x) = a(x – 1)(x + 3) . . . 1) Then substituted (0,3) into the equation 1) into : 3 = a(0 - 1)(x + 3) 3 = -3a a = -1 The equation of quadratic function is : Then the equation of quadratic function is
QUADRATIC FUNCTION The equation of quadratic function of f(x) = ax2 + bx + c if the vertex points of the graph (xp’ yp) and other points can be defined by this formula.
QUADRATIC FUNCTION f(x) = a(x – xp)2 + yp(xp , yp) = (-1, 9) f(x) = a(x + 1 )2 + 9 . . . 1) Subsitusikan titik (3,-7) ke persamaan 1)menjadi : -7 = a(3 + 1)2 + 9 -16 = 16 a a = 1 Example : Define the equation of quadratic function which the vertex point is (-1, 9) and through (3, -7) Answer:
EXPONENT FUNCTION X – 3 –2 – 1 0 1 2 3 ... n 2– 3 2–2 f(x) =2X 2– 1 20 21 22 23 ... 2n D = domain K = Codomain
Y (5,32) (5,32) (4,16) (4,16) (3,8) (3,8) (2,4) (2,4) (1,2) (1,2) (0,1) O X EXPONENT FUNCTION Graph f: x f(x) = 2x for x integer in [0, 5] is: x 0 1 2 3 4 5 F(x)=2x 1 2 4 8 16 32
Y 7 6 f(x )= 2 5 g(x ) = ) = 4 x 1 æ ö ç ÷ 3 ç ÷ 2 è ø 2 1 –3 –2 –1 O 1 2 3 X EXPONENT FUNCTION Graph f(x) = and g(x) = x
EXPONENT FUNCTION Y 7 6 f(x )= 2 5 g(x ) = ) = 4 x 1 æ ö ç ÷ 3 ç ÷ 2 è ø 2 1 –3 –2 –1 O 1 2 3 X Properties Both graphs through point (0, 1) Both graphs is symmetric to Y-axis Graph f: x 2x is increasing graph and graph g: x x Is a decreasing graph and both of them is on X-axis (the function value is always positive) From the curve, we can find the value of 2x and value of For some value of x is real Meanwhile, we can find the quadratic of 2 if the result of quadratic is known. Or: define the logarithm value of a number with logarithm base 2.
LOGARITHM FUNCTION • Logarithm is the turning of exponent. Logarithm function is also the turning of exponent function. Generally, logarithm function is defined as follows: For a > 1, a R
Y X o LOGARITHM FUNCTION Visually, the graph of exponent function and logarithm function are as follows:
EXPONENT FUNCTION Example 1 : • State the following equation into equivalent logarithm. • 8 = 23 • ¼ = 2-2 • Answer : • 8 = 23 2 log 8 = 3 • ¼ = 2-2 2 log¼ = -2 • Example 2 : • State the following equation into equivalent exponent • 4 = 2 log 16 • -6 = 2 log • Answer : • 4 = 2log 16 24 = 16 • -6 = 2log 2-6 =
LOGARITHM FUNCTION Example 3 : Draw the function graph of f(x) = 2 log x+2 Answer : Before drawing the graph, we can use the table below. x f(x) = 2 log x+2 ¼ 0 ½ 1 1 2 2 3 4 4 5 8
LOGARITHM FUNCTION The graph Y 6 5 4 3 2 1 X O -1 -2 1 2 3 4 5 6 7 8 9 10
TRIGONOMETRIC FUNCTION The graph of y = sin x 1 amplitude 0 900 1800 2700 3600 -1 1 period
TRIGONOMETRIC FUNCTION The graph of y = 2 sin x Period 3600 2 Amplitude 2 1 0 900 1800 2700 3600 -1 Y=sin x -2
1 0 900 1800 2700 3600 -1 TRIGONOMETRIC FUNCTION The graph of y = sin 2x period amplitude 450 1350 2250 3150 Y=sin x
TRIGONOMETRIC FUNCTION The graph of y = cos x 1 amplitude -900 -900 00 900 1800 2700 -1 1 period
1 -900 00 900 1800 2700 -1 TRIGONOMETRIC FUNCTION The graph of y = 2cos x period 2 amplitude Y=cos x -2