Download
1 / 17
170 likes | 269 Views
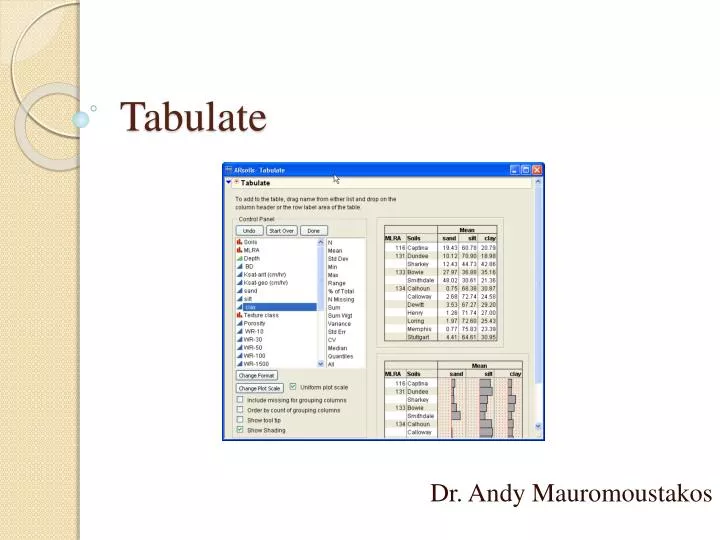
Tabulate. Dr. Andy Mauromoustakos. Tabulate. Objectives Launching the “Tabulate” platform Creating a table of Bulk Density (BD) means for different soils with respect to different depths. Make into a data table Creating a Chart. Tabulate: Launching the platform. Open ARsoils.jmp Data

E N D
Tabulate Dr. Andy Mauromoustakos
Tabulate • Objectives • Launching the “Tabulate” platform • Creating a table of Bulk Density (BD) means for different soils with respect to different depths. • Make into a data table • Creating a Chart
Tabulate: Launching the platform • Open ARsoils.jmp Data • Click Tables Tabulate
Tabulate: Creating a Table • Click and drag the Soils in the left panel of the Tabulate platform and drop it in “Drop Zone for rows”.
Tabulate: Creating a Table • Click and Drag the Mean and drop it near to N as shown below.
Tabulate: Creating a Table • Drag and Drop the variable “BD” into the cell where “Mean” is located. • Now select “Add Analysis Column”.
Tabulate: Creating a Table • Now let us drag and drop the variable “Depth” under “BD” in the table and click “Add
Tabulate: Creating a Table • To set the number of decimals to 2, select “Change Format”
Tabulate: Creating a Table • Now you will see that the cells will have numbers only with two decimal places.
Tabulate: Creating a Table • Now let us create another data using ARsoils data to demonstrate how to make a table & create a graph in Tabulate platform. • Open ARsoils Data. • “Tables” -> “Tabulate” • Drag and Drop the variable “MLRA” into “Drop Zone for row s”. • Select “Add to Grouping
Tabulate: Creating a Table • Drag and Drop variable “Soils” after “MLRA” to create a column of soils as shown below.
Tabulate: Creating a Table • To replace N to “Mean” drag and drop “Mean” into “N”.
Tabulate: Creating a Table • Now Drag and Drop the Variable “Sand” below the “Mean” as shown below and select “Add as Analysis”.
Tabulate: Creating a Table • Drag and Drop “silt” below “sand” as shown below and select “Add as Analysis”. • Similarly, drag and drop “clay” below “silt” as shown below.
Tabulate: Show Chart • Click the platform menu & select “Show Chart” as shown below.
Tabulate: Make into Data Table • To make the created table into a data table, click the platform menu and select “Make Into Data Table”