Download
1 / 21
210 likes | 322 Views
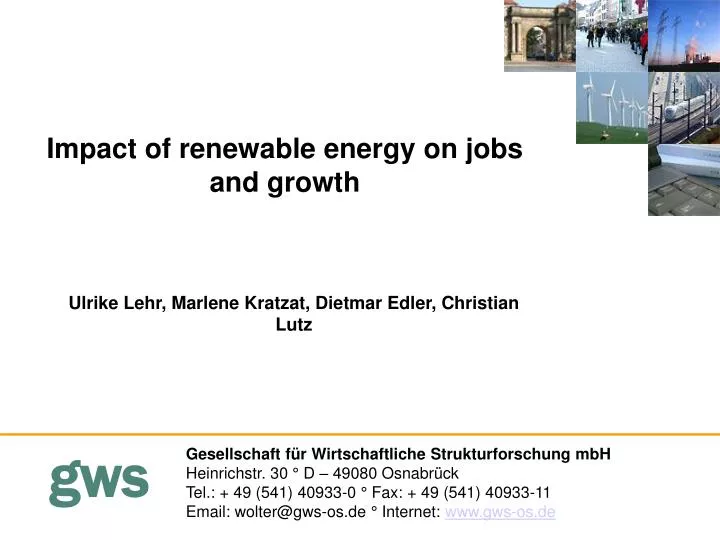
Impact of renewable energy on jobs and growth. Ulrike Lehr, Marlene Kratzat, Dietmar Edler, Christian Lutz. Gesellschaft für Wirtschaftliche Strukturforschung mbH Heinrichstr. 30 ° D – 49080 Osnabrück

E N D
Impact of renewable energy on jobs and growth Ulrike Lehr, Marlene Kratzat, Dietmar Edler, Christian Lutz Gesellschaft für Wirtschaftliche Strukturforschung mbHHeinrichstr. 30 ° D – 49080 Osnabrück Tel.: + 49 (541) 40933-0 ° Fax: + 49 (541) 40933-11Email: wolter@gws-os.de ° Internet: www.gws-os.de
2 Studies up to now, 3rd currently in progress Commissioned by German Federal Ministry of the Environment
What are the effects considered? Increase RES + + + + + + + + + + + + Prices EE RES „ „ Substitutio Substitution “ “ - - - - Neg. effects + + „ „ Budget “ “ Fossil Net - - + + + + + + + + Exports/Imports Investment and O&M Gross employment ? ? - Time (2004-2030) Trade
Investment in RES O&M Investment in fossil fuel facilities Export of RES facilities Import of RES facilities Impact on employment Impact on economic indicators, balance Base year 2004: statistical data, survey, base year 2007 survey in progress Future: Scenarios Input-Output-Tables Macro-economic model: PANTA RHEI How do we quantify these effects?
Earlier studies have shown the economic impacts of an increase in RES compared to the current BAU case. • But how much did the overall support of RES cost and what were the benefits?
The overall effect • Economic effects = the difference between a quantity under one set of framework conditions compared to another set. • Therefore: • Construct reference scenario without any external support of RES. • Has to be speculative! • Base yearofthedevelopment: 1995 • Energysupply = fossil fuels in the “ZERO”-scenarioEconomicIndicators, energydemandandthephasing out ofnuclear = BAU • Wind andbiomassfrom 1995 (2 TWh/a) contributeuntil 1025 reflectingtheirlife time.
Scenarios The analysis is based upon the following set of scenarios: a German target oriented scenario (TOS) that comes close to reach the national target of a 40% (2030) or 80% CO2 reduction by 2050, respectively (BMU04, Leit06, BMU05) a reference scenario that describes a “frozen” state, where no support of RES took place and which derives from the prolonged development up to 1995, international scenarios (reference and dynamic current policy) (IEA-REF04, EREC-DCP04) and the dominant scenario for the development of exports from Lehr et al. 2008 and BMU 2006.
Technology data/ Economic data Survey Production in I-O-T Additional Information from I-O-Tables Data requirements to implement the new sector „Production of facilities using renewable sources“ • Technical details of facilities • Components and modules • Engineering data • Information concerning the structure • Important inputs • Information on sub-suppliers • Production plan • Imports of inputs • Exports • “unimportant” inputs • Structure of similar productions
Data: The survey • Summer 2005 • Approx. 1,100 interviews • Institut für Sozialforschung und Kommunikation • Telephone interviews • Questions on: • Employment (qualification, M/F, FT/PT) • Turnover (national/international input, end product, regional aspects) • Origin of inputs (type, region) • Expectations on future development
Gross Employment in RES Industries, Germany 2004, 2006, 2007 84.300 Wind 82.100 63.900 96.100 Biomass 95.400 56.800 50.700 Solar 40.200 25.100 9.400 increase: rd. 55 % hydro 9.400 300.000 9.500 200.000 235.600 249.300 4.500 160.500 Geothermal 4.200 100.000 jobs 1.800 0 R&D, pub. admin 4.300 4.300 2004 2006 2007 3.400 0 10.000 20.000 30.000 40.000 50.000 60.000 70.000 80.000 90.000 100.000 110.000 Source: BMU Vorhaben: "Kurz- und langfristige Auswirkungen des Ausbaus der erneuerbaren Energien auf den deutschen Arbeitsmarkt", Zwischenbericht März 2008 jobs jobs
Gross employment (direct and indirect) 2004 bis 2030 Projection of productivity Projection of the direct/indirect ratio Scenarios
Net effects I Budget effect from additional costs of RES: e.g. PV
Net effects II Total investment for ZERO and comparison to TOS
Modeling Environment France REGIO Since 2004 INFORGE 59 Sectors Since 1995 Japan World Trade Model (53 countries and regions) States 16 States Since 1998 UK PANTA RHEIEnergy und Environment Since 1997 USA ... Branches Since 1996 GINFORS Seit 1998
Demand Input Production Imports (consumption, demand Exports, Investment) energy Prices from prices production added value Productivity & wages employment income PANTA RHEI – macro-econometric model
Changes of important economic indicators in the TOS – absolute values from ZERO Results
Thank you for your attention!For more:www.gws-os.delehr@gws-os.de