Download
1 / 28
280 likes | 390 Views
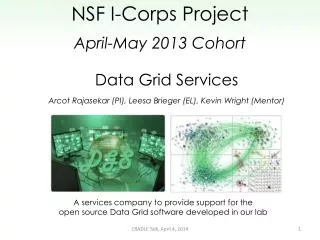
JKL Aviation Grid Services. Dusty Harbage – Aviation Program Leader Brian Schoettmer – Asst. Aviation Program Leader. NWS Grid Methodology.

E N D
JKL Aviation Grid Services Dusty Harbage – Aviation Program Leader Brian Schoettmer – Asst. Aviation Program Leader
NWS Grid Methodology • Various meteorological parameters are forecast by entering quantifiable values into a gridded database and shipped to the National Digital Forecast Database (NDFD)
JKL Aviation Grids • Edited using Graphical Forecast Editor (GFE) in AWIPS. • Finished product is sent to National Digital Forecast Database (NDFD) and to our website. (www.weather.gov/jkl)
Aviation Grid Editing • Edits are made using certain “smart” tools to fit the meteorological setup. Also, certain edit areas are used to define east Kentucky’s complex topography. -Ridges, Mountains, Valleys, Extreme Valleys, River Valleys, etc. • Forecast values are entered into 2.5 km X 2.5 km grid boxes.
Aviation Forecast vs. Public Forecast • Public forecast parameters include - T, Td, RH, MaxT, MinT, Wind, Wind Gust, Sky, POP, POP12, WX, QPF, Snow Amount. • Extra aviation forecast parameters include - Ceiling Height, Predominant Height, and Visibility • Public forecast parameters are populated into the aviation grids. - For example, sky cover from the public forecast is imported into the aviation grids and used to derive ceilings.
East Kentucky Terrain • How do we depict terrain differences? A common view from WFO JKL!
Visibility Grids River Valley Fog
Valley Fog… Ridges 10 SM Valleys 5 SM River Valleys 3 SM
Predominant and Ceiling Height Derivation • Consider an approaching weather system with clear skies in place. • Generally, you will have upper level clouds stream in first and slowly saturate the column. How is this depicted?
Predominant and Ceiling Height Derivation • Sky cover at a given hour.
Predominant and Ceiling Height Derivation • What the sounding might look like for an approaching system. Notice saturation of the upper levels first. SCT – BKN Clouds around 20,000 feet.
Predominant and Ceiling Height Derivation • Use model data and upstream observations to forecast predominant height of the clouds. Rain Notice the lowering cloud heights (saturating the atmospheric column) Virga
Smart Tools Used • PredHgt_fm_Sky_Lowering - great for incoming systems where cigs are gradually lowering as atmospheric column saturates.
Predominant and Ceiling Height Derivation • Once your sky cover and predominant height are determined, ceiling height can be derived using a “smart” tool that combines the two parameters. Smart tool removes sky cover less than 57% since it is not considered a ceiling.
Smart Tool Used • CigHgtFmPredHgtAndSky (ceiling height from predominant height and sky) - used to combine sky cover (cig/no cig) with predominant cloud height to determine cig height.
The Big Picture Sky Cover Grid Ceiling Height Predominant Height
JKL’s Aviation Web Page • www.weather.gov/jkl Click Here
Aviation Web Services • Point and Click TAF’s. -our 3 TAF airports are highlighted in bold. Point and click TAF’s can be obtained for any airport in the CWA with gridded data.
The Final Product • What Do Our Customers See?
The Final Product Scattered Rain Showers Lowering Cigs No Cigs Lowering Vis Due to Light Rain
The Final Product • What Do Our Customers See?
Aviation Grid Pros • More data for pilots to use for supplementing an official weather brief. • Presented in a graphical and easy-to-understand format. - Hourly weather graphs • Point and Click “TAFS” - Airports that do not have TAF’s still have a forecast. • Easy to use information at your fingertips.
Aviation Grid Cons • TEMPO weather conditions are not currently depicted in the grids. Could this be done? • How do we handle varying terrain? - Since CIGS are AGL, a smart tool is used to lower CIGS for higher terrain MSL. (MSL to AGL) - What is the proper conceptual model? How do cloud bases vary over complex terrain? (stratiform or convective)
Cons Continued… • There is concern that the public will use gridded information and not obtain an official weather brief. - NWS liability? • In the end, it is the responsibility of the pilot in command (PIC) to obtain all necessary weather information to plan a flight. - Our gridded data should be used as a supplement to an official weather brief.
Future Plans • A proposal was sent to Central Region Headquarters suggesting ceiling and visibility grids for NDFD across CR. • This will be a possibility once LAMP Guidance is available to populate in NDFD for initialization. • JKL will likely be a test site when this occurs.
Questions?...Comments? • Thank You! • Questions or comments can be e-mailed to Dustin.Harbage@noaa.gov