1 / 1

tavita
Download Presentation

An Image/Link below is provided (as is) to download presentation Download Policy: Content on the Website is provided to you AS IS for your information and personal use and may not be sold / licensed / shared on other websites without getting consent from its author. Content is provided to you AS IS for your information and personal use only. Download presentation by click this link. While downloading, if for some reason you are not able to download a presentation, the publisher may have deleted the file from their server. During download, if you can't get a presentation, the file might be deleted by the publisher.

E N D

Presentation Transcript


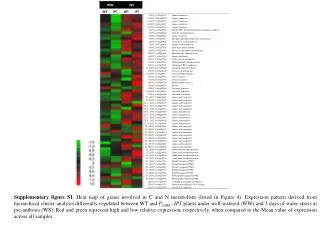
  1. Supplementary figure S1. Heat map of genes involved in C and N metabolism (listed in Figure 4). Expression pattern derived from hierarchical cluster analysis differently regulated between WT and PSARK::IPT plants under well-watered (WW) and 3 days of water-stress at pre-anthesis (WS). Red and green represent high and low relative expression, respectively, when compared to the Mean value of expression across all samples.

More Related