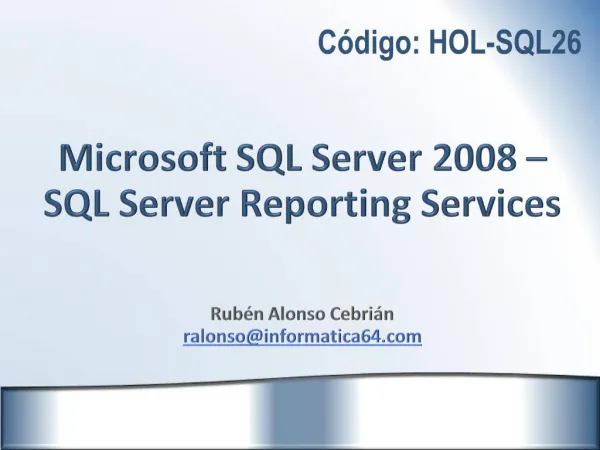
SQL Server 2008 R2 and the Reporting Services
SQL Server 2008 R2 and the Reporting Services. Christophe Codourey Consultant BI Christophe.codourey @ trivadis.com Trivadis SA Rue Marterey 5 CH-1005 Lausanne. WebUI. Programatic Interface (Web Service). Format (HTML, Excel, PDF, Word, …). Data Sources

SQL Server 2008 R2 and the Reporting Services
E N D
Presentation Transcript
SQL Server 2008 R2 and the Reporting Services Christophe Codourey Consultant BI Christophe.codourey@trivadis.com TrivadisSA Rue Marterey 5 CH-1005 Lausanne
WebUI Programatic Interface (Web Service) Format (HTML, Excel, PDF, Word, …) Data Sources (SQL, SharePoint, ODBC, Oracle, Custom) ReportServer Rendering Data Retrieval SQL Server Catalog SQL Server 2008/R2 Reporting Services Browser Excel Custom App Atom Feed SharePoint Report Processing Security Delivery Distribution (E-mail, File share, Userdefined) Security Services (NT, Passport, Custom)
Report Design Tools Report Builder 3.0 BI Dev Studio RDL
WebUI Programatic Interface (Web Service) (HTML, Excel, PDF, Word, …) Data Sources (SQL, SharePoint, ODBC, Oracle, Custom) ReportServer Rendering Data Retrieval SQL Server Catalog Agenda Browser Excel Custom App Atom Feed SharePoint Report Processing Security Delivery Distribution (E-mail, File share, Userdefined) Security Services (NT, Passport, Custom)
Data extension supports SharePoint 2007/2010 sites Visual Query Designer SharePoint Data Source • <RSSharePointListxmlns:xsi="http://www.w3.org/2001/XMLSchema-instance" xmlns:xsd="http://www.w3.org/2001/XMLSchema"> • <ListName>SuperLeagueTeams</ListName> • <ViewFields> • <FieldRef Name="ShortName" /> • <FieldRef Name="Title" /> • <FieldRef Name="Logo" /> • </ViewFields> • </RSSharePointList>
Available in SQL Server 2008 R2 Release Candidate SQL Azure and SQL Parallel Data Warehouse T/SQL SQL Azure
WebUI Programatic Interface (Web Service) (HTML, Excel, PDF, Word, …) Data Sources (SQL, SharePoint, ODBC, Oracle, Custom) ReportServer Rendering Data Retrieval SQL Server Catalog Agenda Browser Excel Custom App Atom Feed SharePoint Report Processing Security Delivery Distribution (E-mail, File share, Userdefined) Security Services (NT, Passport, Custom)
New text orientation option provides more flexibility to the report layout New Writing Mode: Rotate270
More control over page breaks Tablix, Rectangle and Group Page Breaks and Naming of Excel Worksheets =Globals!PageName & " Page: " & Globals!PageNumber & " of " &Globals!TotalPages ="Overall Page: " & Globals!OverallPageNumber & " of " & Globals!OverallTotalPages
Use expressions to determine what renderer is being used Dynamically disable/enable page breaks Dynamic page breaks Disable page breaks if exporting to Excel.
Control layout and write expressions that consider renderer format Renderer-based expressions Dynamically disable drill through expressions for non-interactive renderers and enable them for interactive ones
Nesting of aggregate functions is now supported e.g. Average Month Sales =Avg(Sum(Quantity, "Quarter"), "Year") Aggregates of Aggregates AVG AVG SUM
Datasets can be shared, stored, processed and cached externally from the report. Cache refresh plans work on cached reports or shared dataset query results On first use Via a schedule Shared (Cached) Data Sets
Values from one DataSet can be usedto get Value(s) fromanother DataSet Lookup (1:1) MultiLookupGet multiple values,-> Param 1 is an array LookupSet (1:n) E.g. Get all phone nr from a selected customer Lookup & Co =Lookup(Fields!TeamA.Value ,Fields!Title.Value ,Fields!ShortName.Value ,"SuperLeagueTeam")
WebUI Programatic Interface (Web Service) (HTML, Excel, PDF, Word, …) Data Sources (SQL, SharePoint, ODBC, Oracle, Custom) ReportServer Rendering Data Retrieval SQL Server Catalog Agenda Browser Excel Custom App Atom Feed SharePoint Report Processing Security Delivery Distribution (E-mail, File share, Userdefined) Security Services (NT, Passport, Custom)
Sparklines “Data intense, word-sized graphics” – Invented by Edward Tufte Automatic axis alignment. All charts will have the same number of data points, regardless of source data. Convertable into full charts Data Bars Show a single value in a cell. Min and Max are automatically determined, but are configurable. Sparklines and Data Bars Sparklines Data Bars
Sparklines = Fields!TeamB.Value & " " & Fields!Result.Value = iif(Fields!HomeGame.Value = 1, "Blue", "LightBlue")
Sparklines are regular charts with predifined property values Convert to Full Chart
Icons Show status against a value, a goal or a trend Own Icon Sets can becreated by Report Author Color, icon and size can be changed based on data Automatic support for comparing each member of a group against siblings • Indicators Indicators
Authoring ReportsMany types of layouts Custom Subtotals Non-pivot columns Custom Headers Pivot Multi-Pivot Stepped or Block grouping Nested controls
“Map” Data • The product team currently plans on publishing links (Books On-Line/MSDN) to a number of map file providers when the product releases. However, we do not have a list that we can release at this time. Europe shape Files: http://www.cdc.gov/epiinfo/europe.htm
How to deal with Shape Files SZ.SHP http://www.sharpgis.net/page/shape2sql.aspx
Union on Shape Data Works currently only in Report Builder
WebUI Programatic Interface (Web Service) (HTML, Excel, PDF, Word, …) Data Sources (SQL, SharePoint, ODBC, Oracle, Custom) ReportServer Rendering Data Retrieval SQL Server Catalog Agenda Browser Excel Custom App Atom Feed SharePoint Report Processing Security Delivery Distribution (E-mail, File share, Userdefined) Security Services (NT, Passport, Custom)
More intuitive UI Search Support Manage Report without rendering New “Reports Portal” (Native Mode)
Publish report items to the catalog for re-use Users can mix & mash different report items for their desired views Grab-and-go reporting
ATOM Data Feed (do it yourself) • string uri ="http://.../ReportServer?/Dir/MatchResult&rs:Command=Render &rs:Format=ATOM&rc:DataFeed=xAx0x1"; • var client = new WebClient(); • client.Credentials = CredentialCache.DefaultCredentials; • Stream atomStream = client.OpenRead(uri); • XDocument document = XDocument.Load(atomStream); • var query = from feed in document.Descendants(XName.Get("properties", "http://schemas.microsoft.com/ado/2007/08/dataservices/metadata")) • select new • { • TeamA = feed.Element(XName.Get("TeamA", "http://schemas.microsoft.com/ado/2007/08/dataservices")).Value, • TeamB = feed.Element(XName.Get("TeamB", "http://schemas.microsoft.com/ado/2007/08/dataservices")).Value, • }; • ResultList.ItemsSource = query.ToList(); Feed-ID
ATOM Data Feed (do it yourself) • <?xmlversion="1.0" encoding="utf-8" standalone="yes"?> • <feedxmlns:d="http://schemas.microsoft.com/ado/2007/08/dataservices" • xmlns:m="http://schemas.microsoft.com/ado/2007/08/dataservices/metadata" xmlns="http://www.w3.org/2005/Atom"> • <titletype="text"></title> • <id>uuid:0957b3c6-2d59-46b7-bcd8-ed0cfd5a48b0;id=2351</id> • <updated>2010-03-29T06:44:25Z</updated> • <entry> • <id>uuid:0957b3c6-2d59-46b7-bcd8-ed0cfd5a48b0;id=2352</id> • <titletype="text"></title> • <updated>2010-03-29T06:44:25Z</updated> • <author /> • <contenttype="application/xml"> • <m:properties> • <d:Roundm:type="Edm.Int32">1</d:Round> • <d:TeamA>FC Aarau </d:TeamA> • <d:TeamB>Grasshopper Club Zürich </d:TeamB> • <d:Result>01:00</d:Result> • <d:Pointsm:type="Edm.Int32">3</d:Points> • </m:properties> • </content> • </entry> • <entry> • <id>uuid:0957b3c6-2d59-46b7-bcd8-ed0cfd5a48b0;id=2353</id> • ...
Additional data sources, detail improvements for report authoring and data distribution SharePoint Lists, SQL Azure Page breaks, text rotation, info of render format, aggregates of aggregates Shared datasets Atom data feed New features in the area of better data visualization Data Bars Sparklines Indicators High flexibility for displaying Spatial Data Shape Files Bing Maps It’s not a revolution but the next evolution level Release 3.0 ;-) Conclusion
Thank you for your Attention! • For more Information please contact • Christophe Codourey • Consultant BI • Christophe.Codourey@trivadis.com • Trivadis SA • Rue Marterey 5 • CH-1005 Lausanne