Download
1 / 55
550 likes | 724 Views
Energy-Efficiency Technologies in Northeast Asia and the Global Energy Demand SRES Scenarios. Nan Zhou Environmental Energy Technologies Division Lawrence Berkeley National Laboratory 14 May 2005. Presentation Contents. Energy-Efficiency Programs and Technologies in Northeast Asia

E N D
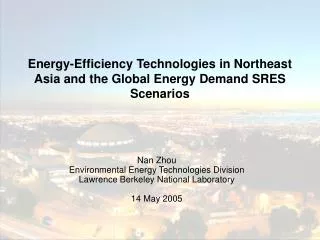
Energy-Efficiency Technologies in Northeast Asia and the Global Energy Demand SRES Scenarios Nan Zhou Environmental Energy Technologies Division Lawrence Berkeley National Laboratory 14 May 2005
Presentation Contents • Energy-Efficiency Programs and Technologies in Northeast Asia • The Impact of Energy Efficient Technologies in Building Sector • The Implementation of Energy Efficiency Programs in China • The Disaggregation of the SRES Scenarios : China Buildings Sector Example
Comprehensive Energy-Efficiency Policies and Regulations by Country • Comprehensive Energy Efficiency policies exists in each country • 5 major countries or region were addressed here.
Industry Energy-Efficiency Policies and Regulations by Country
The Impact of Energy Efficient Technologies in Building Sector
The Impact of Energy Efficiency Appliances China: Cumulative saving from efficient refrigerators by 2001 reached 1.17 billion kWh or RMB 670 million at an electricity price of RMB 0.57 per kWh. Japan: The energy efficiency standards adopted in the framework of the 1993 Energy Conservation Law calls for the improvement in energy efficiency of: • 5-6% for single-purpose air-conditioners and combined air-conditioners and cooling units over the FY 1992 results by the end of September 1998. • 3-7% for fluorescent lamps by 2000 compared to that of FY 1992. • 5-25% for televisions by FY 1998 compared to that of FY 1991. • 3% for copying machines by FY 2000 compared to that of FY 1992. • 30% for electronic computers by FY 2000 compared to that in FY 1992. • for magnetic disk units : 60% for single disk units and 80% for multi-disk drives by FY 2000 compared to that of FY 1992. Russia: By retrofitting general-purpose industrial equipment such as motors, boilers and industrial heating systems with more energy-efficient technologies. Project investment are usually paid back in less than 3years, and it is estimated that 8.7 Mtoe will be saved annually in 2002-2005, equivalent to 5.8 % of final total energy consumption in 2000. Chinese Taipei: • Implementation of efficiency standards for electrical appliances has resulted in an average annual peak load power saving of 130 MW. • The voluntary efficiency labels certify that products are 10 % to 30 % more efficient than required by the MEPS. • The energy factor of an advanced energy-efficient refrigerator was 23 % higher than that of a baseline model. It can improve refrigerator efficiency by another 30 to 40 %.
The Impact of Energy Efficiency standards in Building Sector —Building Codes Japan: stricter application of building standards for heat insulation was enforced in April 2001. The new standards could save 20% of energy use for air conditioning and are expected to cost around 1 million Yen(approximately $9,000) per house. Russia: Energy consumption in these buildings is targeted to decline by 14 to 16 % by 2005 compared to 2000, with total energy savings of 3.2 Mtoe in 2002-2005 and 5.8 Mtoe in 2006-2010. The corresponding cut in government energy bills should amount to 500 million roubles (US$17 million) in 2002-2005 and 3.1 billion roubles (US$100 million) in 2006-2010.
Feasibility Study of The Impact of Energy Efficient Technologies in Commercial Building Energy-Efficient Alternatives Considered for a Proposed Demonstration Building heat transfer through the envelope cooling equipment efficiency • The USDOE and China’s MOST joint energy-efficient demonstration building with U.S. technologies • cross-shaped base building were determined and computer simulations used. For more information on this phase of the project, please refer to the web site for Accord 21 (American Chinese Coalition Organized for Responsible Development) , the umbrella organization led by NRDC to implement this effort (http://www.nrdc.org/china/ebinx.html).
The Energy Use and Cost Saving of Building Shape The shape of a building has a definite impact on its energy use characteristics. In a heating-dominant situation, a compact shape helps to reduce heat losses through the building shell and can improve the building’s energy efficiency.
Energy and Energy Cost Saving between Base Case and Combined Measure • The energy cost savings from incorporating these measures into the Base Case design are estimated to be from 40 to 43%. • cross-shaped design and the orientation can save an additional 5% or more of the energy costs. • The total source energy reductions is: about 52% of the electricity savings or about 41% for combined source energy for natural gas and electricity. Site energy refers to the amount of energy consumed at the building; source energy refers to the amount of energy consumed at the power plant to provide that site energy to the consumer.
Impact on Energy Efficient Fluorescent Lamp The life-cycle cost analysis for Chinese fluorescent lamps Less than 3 months Modest improvements in efficiency in a large market could lead to large aggregate reductions. In the case of China’s 2003 minimum energy efficiency standard for fluorescent lamps, these reductions could amount to 80 TWh in electricity use and almost 100 million tons in CO2 emissions reductions in the next 10 years. Three most widely used lamp groups are chosen here for further analysis, each characterized by its length (and associated wattage ranges): 600 mm (18–20 W), 900 mm (30 W), and 1200 mm (36–40 W) lamps. These products are distinguished and referenced by their tube diameters (T8–T12); typically the thinner lamps are more energy efficient.
A Case Study of the Impact of CHP Table : Office Building DER-CAM Results Heat recovery for cooling is not economic for sports facility 1 1 3 2 The peak load shift effect of prototype building
The Economic and Environmental Effect of Prototype Buildings Figure: The effect of prototype building carbon emission reduction Figure: The economic effect of prototype building
Energy Efficiency Programs in China With International Cooperation
ResearchandPolicy Advice Data Acq. & Analysis Technical Assistance LBNL China Activities Institution & Capacity Bldg Buildings Industry Cross-Cutting • Energy Efficiency Agreements • Motor Systems Design • BEST Tool • Refining & Product Quality • Shanghai ESCO Industry • Energy Efficiency Investment Analysis • National Energy Strategy Assessment • Government Procurement • Carbon Scenarios Study • China Energy Databook Equipment Building Shell • Minimum Standards • Voluntary Energy Labeling • Residential Energy Consumption Survey • Rural Household Energy • Commercial and Residential Codes • Demonstration Buildings • Windows Labeling close work with China’s authorities for 10 years, since China first modernized their standards and codes. worked with government and industrial partners to introduce international best practice publication of compiled China energy and environmental data, and assistance in creating government programs. Energy and Emissions Savings
Accomplishment To Date • Buildings • Appliance standards • 10 mandatory equipment efficiency standards • Reach standard • Energy efficiency labels • 8 voluntary energy efficiency labeling specifications • Bilateral and regional harmonization • Building codes • Residential and commercial buildings codes in 4 regions; window labeling • Industry • Industrial energy efficiency agreements • Pilot program in the iron & steel industry in Shandong; extending nationwide • Motors systems optimization program • Cross-Cutting • China’s low-carbon future research • Creation of major new policy analysis tool • Data compilation and analysis • 6th Edition of China Energy Databook • Government procurement • New (2005) mandatory policy designed on the US FEMP program • Energy policy research and analysis • Institution building • Beijing Energy Efficiency Center, Energy Foundation China Sustainable Energy Program
New technical basis for China’s appliance energy efficiency standards and labeling programs • Technology Transfer • Techno-economic analysis for standards (DOE) • Technical analysis for labeling (EPA) • Methodology • Engineering, Energy, Environmental, Finance, Social Impact Modeling • International Collaboration • Harmonization of standards, labeling specifications and test procedures (same test procedures and product classification)
External Power Supply Collaboration • China, US EPA, California Energy Commission, Australia Greenhouse Office, EU Code of Conduct • Agreement on new test procedure • China led testing program; one dataset created • Two international coordination meetings • Coordination on proposed specification and product coverage • Attendance at stakeholder meetings • Joint announcement of program and joint US-China launch (1 January 2005)
China and Harmonization • China is the key global power supply player • More than 50% of global power supply production • Number of power supply-containing products in homes and businesses is growing exponentially • China is experiencing power shortages • Harmonization recognizes the global market • China exports over half of its power supply production • China is a major exporter of power supply-containing products • Harmonization benefits • Lower manufacturers’ costs • Lower testing costs • Lower program administration costs • Reduced barriers to trade
Potential Savings in China • Use of efficient power supplies in 12 major end-uses would reduce consumption by 1.23 TWh (half-percent of total residential energy use) or $86 million in consumer electricity charges largest possible savings (3 products not shown)
Improved New Heating ZoneResidential Building Code Shanghai CommercialCode New Residential Building Code New Residential Building Code Buildings: Training in Developing New Building Codes Commercial and Government Building Code (national)
The Industrial Sector Is Extremely Important in China • The industrial sector represents 68% of all primary energy consumption in China • There is strong growth in industrial primary energy use • China is the world’s largest producer of cement, steel, and ammonia and in top-10 for production of aluminum, paper, and petroleum • Industrial production is necessary for China’s infrastructure development: roads, buildings, equipment • High levels of industrial production and energy use has serious environmental consequences including air pollution, water pollution, industrial waste, and greenhouse gas emissions contributing to global warming
Efficiency Policy for Iron & Steel Industry General Economic and Political Environment China’s Energy Efficiency Programs of the 1980s Voluntary Agreement Sector Target Policy Industrial Sector Policies in Developed Countries Planned Economy Market Economy Planned Economy Market Economy Iron & steel sector largest in world; consumes 13% of total energy in China
Potential Energy Savings: Shandong Province Pilot and China Steel Sector The pilot encompassed two major plants in Shandong. Both were already better than the China average. Both plants agreed to increase their efficiency efforts based on actions identified with the BEST benchmarking tool to achieve by 2005 a level of efficiency equal to the advanced international level in 2000. A recent performance review showed that both plants were well on their way to achieving these targets.
The success of our work in China relies heavily on cooperation with a wide range of organizations and groups • Funding support from US Government and private foundation sources • Close work with Chinese government and research centers. • Inform to US government agencies and support of bilateral US-China energy agreements. • Internal and external experts
Expected Future Efforts • Energy Consuming Equipment • Additional product minimum standards • New appliance standards implementation policy • Additional labeled products • Extension of standards & labeling approach to new initiatives such as government procurement • Buildings • Technical support for building codes • Industry • Expand individual studies to support national and provincial targets • Cross cutting • Fiscal and tax policy options for energy efficiency • Improve data collection, particularly end-use • Expand efforts to raise profile of energy efficiency policy
Disaggregation of the SRES Scenarios China Buildings Sector Example
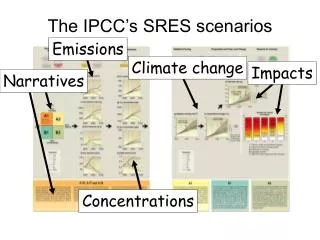
Special Report on Emissions Scenarios (SRES) • Produced baseline scenarios to 2100 • Four major storylines: A1, A2, B1, B2 • Four world regions: OECD90, countries undergoing economic reform(REF), Asian nations (ASIA), and Africa and Latin American countries (ALM). • Four marker scenarios • Energy use, fossil-fuel CO2 emissions
SRES Storylines A2: Slower economic and technological growth, high population growth A1: Rapid economic growth, low population growth, rapid introduction of new and more efficient technologies B2: Intermediate economic growth, moderate population growth, and less rapid but more diverse technological change B1: Transition to a service-oriented economy with clean and efficient technologies, low population growth
Primary Energy Use - World SRES Marker Scenarios 1000 900 800 700 A1 AIM 600 A2 ASF Exajoules 500 B1 IMAGE 400 B2 MESSAGE 300 200 100 0 1990 2000 2010 2020 2030 World and Asia Fossil Fuel CO2 Emissions and Primary Energy Use, 1990-2030
Motivation • IPCC-SRES – Most models lacked detail on energy demand by end-use technology, • Inadequate ability to capture the potential for efficiency improvement and the impacts of efficiency programs • Energy intensity improvement potential not disaggregated by • Energy efficiency • Usage • Technology size/scale • Lack of intra-region disaggregation • Some modelers have since begun to include demand-side technologies – AIM for Asia for example • Growing interest and demand for end-use global analysis
Near- and Long-Term Goals • Near-term Goals: • Initiate a collaborative process for sectoral energy demand analysis with IPCC authors and other collaborators • Seek comments and commitments for collection of regional data from participants • Goal is to draft base case scenarios, particularly for the sectoral chapters. • Long-term goals: • Develop a data base on demand-side technologies in order to facilitate the development of energy scenarios • Assess significance of technology potential and costs in a global climate change model • Provide input to LBNL and other energy and climate change models
China (B2 Marker Scenario): Driver Variables for Bottom-up Characterization of Buildings Sector
Drivers population household sizes GDP, income household area per capita heating/cooling loads per m2 (includinginfiltration) lighting loads urbanization rates rural/urban splits heating/non-heating region splits Technical characteristics saturation levels of alternative devices for each end use cooking appliances (refrigerator, washing machine, TV, other) lighting (traditional, efficient) space heating space cooling energy types for devices electricity fossil fuels biofuels energy & emissions intensities by device, over time China Buildings Sector (B2 Marker Scenario)Variables for Residential Buildings
Drivers population, GDP, income commercial area per capita heating/cooling loads per m2 lighting loads per m2 heating/non-heating region splits Building types hotel office Hospital Retail school other Technical characteristics shares or saturation levels of alternative devices for each end use space heating space cooling lighting other energy types for devices electricity fossil fuels energy & emissions intensities by device over time China Buildings Sector (B2 Marker Scenario)Variables for Commercial Buildings
China Buildings Sector (B2 Marker Scenario)Bottom-up Modeling Results (primary energy)
Example: Urban Residential RefrigeratorsB2 simulation results • Refrigerators are a major electricity user • They will account for over 40% of appliance energy use (excluding room air conditioners) and 20% of urban household electricity use in 2030.
Example: Urban Residential RefrigeratorsSensitivity Current data on the Chinese market and information on possible future efficiency standards are used. Three efficiency classes in each of three typical refrigerator sizes (170 liters, 220 liters, and 270 liters). Average intensity are assumed to decline over the 2000 to 2030 period, The average size of new refrigerators is assume to rise, as well as the rate of ownership, which increases from 80% of urban households to 95%.
As larger refrigerators grow to dominate energy consumption, the share of efficient models also rises.
The Global Energy Demand Database: A Shared Resource for Modelers Worldwide Vision: The GED Database will be a collaboratively designed and created resource, maintained by LBNL for the use of all contributors. It will be a sharedresource for project participants and collaborators. • Ability of participating groups to provide data and documentation will determine GED database content. • Each sector in each region will be built up from detailed data on energy consumption, technology, and drivers. • Users are free to determine applications. • For example, GED database used in the LBNL GED Model will allow simulationof demand consistent with existing scenarios as well as creation of new scenarios.
2005 Schedule • January - April: • Identify region/country/sector experts; • LBNL to develop data collection spreadsheets, and aggregate default data • Spreadsheets with default data sent to experts in April • April - June: • Experts prepare detailed data for the model • Spreadsheets returned to LBNL in June • June- September: • LBNL to begin data analysis and scenario disaggregation • Preliminary disaggregated baseline scenario developed • Results provided to AR4 writing teams
Thank you! • 谢谢! • どうもありがとう
Data Needs: Kaya Identity Applied at the End-Use Sector and Technology Level End-use Sector Level Buildings Example ERB,I = energy demand in the residential buildings sector in region i, Pi = population in region i, Fi = number of persons per household (family) in region i, Hi = average floor area per household in region i in m2, and EIRB,I = average energy intensity in the residential sector in region i in MJ/m2-year. Technology Level k = energy type m = locale type (urban, rural) n = housing type (detached home, multifamily unit, other home) SHi = space heating energy intensity in residential buildings in region i in MJ/m2-year, SCi = space cooling energy intensity in residential buildings in region i in MJ/m2-year, j = type of appliance or end-use device, pi,j = penetration of appliance or device j in region i, UECi,j = average energy intensity of appliance j in region i Ci = average cooking and water heating energy use per household in region i, Li = average lighting energy use per household in region i, and Ri = residual household energy use in region i.