Download
1 / 60
780 likes | 1.34k Views
Evaluation of Laboratory Data in Nutrition Assessment. Cinda S. Chima, MS, RD. Laboratory Data and the NCP. Used in nutrition assessment (a clinical sign supporting nutrition diagnosis) Used in Monitoring and Evaluation of the patient response to nutritional intervention. Specimen Types .

E N D
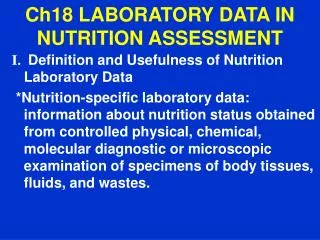
Evaluation of Laboratory Data in Nutrition Assessment Cinda S. Chima, MS, RD
Laboratory Data and the NCP Used in nutrition assessment (a clinical sign supporting nutrition diagnosis) Used in Monitoring and Evaluation of the patient response to nutritional intervention
Specimen Types • Serum: the fluid from blood after blood cells and clot removed • Plasma: fluid from blood centrifuged with anticoagulants • Erythrocytes: red blood cells • Leukocytes: white blood cells • Other tissues: scrapings and biopsy samples • Urine: random samples or timed collections • Feces: random samples or timed collections • Less common: saliva, nails, hair, sweat
Interpretation of Routine Medical Laboratory Tests Clinical Chemistry Panels Basic metabolic panel Comprehensive metabolic panel Complete blood count Urinalysis Hydration status
Clinical Chemistry Panels: Basic Metabolic Panel (BMP) Also called Chem 7 Includes • Electrolytes: Na+, K+, Cl-, HCO3 or total CO2 • Glucose • Creatinine • BUN
Clinical Chemistry Panels:Comprehensive Metabolic Panel Includes • BMP except CO2 • Albumin • Serum enzymes (alkaline phosphatase, AST [SGOT], ALT [SGPT] • Total bilirubin • Total calcium Phosphorus, total cholesterol and triglycerides often ordered with the CMP
Clinical Chemistry Panels: Complete Blood Count (CBC) • Red blood cells • Hemoglobin concentration • Hematocrit • Mean cell volume (MCV) • Mean cell hemoglobin (MCH) • Mean cell hemoglobin concentration (MCHC) • White blood cell count (WBC) • Differential: indicates percentages of different kinds of WBC
Types of Assays • Static assays: measures the actual level of the nutrient in the specimen (serum iron, white blood cell ascorbic acid) • Functional Assays: measure a biochemical or physiological activity that depends on the nutrient of interest (serum ferritin, TIBC) • (Functional assays are not always specific to the nutrient)
Assessment of Hydration Status • Dehydration: a state of negative fluid balance caused by decreased intake, increased losses, or fluid shifts • Overhydration or edema: increase in extracellular fluid volume; fluid shifts from extracellular compartment to interstitial tissues • Caused by increase in capillary hydrostatic pressure or permeability • Decrease in colloid osmotic pressure • Physical inactivity • Use laboratory and clinical data to evaluate pt
Hypovolemia Isotonic fluid loss from the extracellular space caused by • Fluid loss (bleeding, fistulas, nasogastric drainage, excessive diuresis, vomiting and diarrhea) • Reduced fluid intake • Third space fluid shift, when fluid moves out of the intravascular space but not into intracellular space (abdominal cavity, pleural cavity, pericardial sac) caused by increased permeability of the capillary membrane or decrease on plasma colloid osmotic pressure
Symptoms of Hypovolemia • Orthostatic Hypotension (caused by change in position) • Central venous and pulmonary pressures • Increased heart rate • Rapid weight loss • Decreased urinary output • Patient cool, clammy • Decreased cardiac output • Ask the medical team!!
Treatment of Hypovolemia • Replace lost fluids with fluids of similar concentration • Restores blood volume and blood pressure • Usually isotonic fluid like normal saline or lactated Ringer’s solution given IV
Hypervolemia • Excess of isotonic fluid (water and sodium) in the extracellular compartment • Osmolality is usually not affected since fluid and solutes are gained in equal proportion • Elderly and those with renal and cardiac failure are at risk
Causes of Hypervolemia • Results from retention or excessive intake of fluid or sodium or shift in fluid from interstitial space into the intravascular space • Fluid retention: renal failure, CHF, cirrhosis of the liver, corticosteroid therapy, hyperaldosteronism • Excessive intake: IV replacement tx using normal saline or Lactated Ringer’s, blood or plasma replacement, excessive salt intake
Causes of Hypervolemia • Fluid shifts into vasculature caused by remobilization of fluids after burn tx, administration of hypertonic fluids, use of colloid oncotic fluids such as albumin
Symptoms of Hypervolemia • No single diagnostic test, so signs and symptoms are key • Cardiac output increases • Pulse rapid and bounding • BP, CVP, PAP and pulmonary artery wedge pressure rise • As the heart fails, BP and cardiac output drop • Distended veins in hands and neck
Symptoms of Hypervolemia • Anasarca: severe, generalized edema • Pitting edema: leaves depression in skin when touched • Pulmonary edema: crackles on auscultation • Patient SOB and tachypneic • Labs: low hematocrit, normal serum sodium, lower K+ and BUN (or if high, may mean renal failure) • ABG: low O2 level, PaCO2 may be low, causing drop in pH and respiratory alkalosis
Treatment of Hypervolemia • Restriction of sodium and fluid intake • Diuretics to promote fluid loss; morphine and nitroglycerine to relieve air hunger and dilate blood vessels; digoxin to strengthen heart • Hemodialysis or CAVH
Dehydration • Excessive loss of free water • Loss of fluids causes an increase in the concentration of solutes in the blood (increased osmolality) • Water shifts out of the cells into the blood • Causes: prolonged fever, watery diarrhea, failure to respond to thirst, highly concentrated feedings, including TF
Symptoms of Dehydration • Thirst • Fever • Dry skin and mucus membranes, poor skin turgor, sunken eyeballs • Decreased urine output • Increased heart rate with falling blood pressure • Elevated serum osmolality; elevated serum sodium; high urine specific gravity
Treatment of Dehydration • Use hypotonic IV solutions such as D5W • Offer oral fluids • Rehydrate gradually
Laboratory Values and Hydration: BUN Adapted from Charney and Malone. ADA Pocket Guide to Nutrition Assessment, 2004.
Laboratory Values and Hydration Status: BUN:Creatinine Ratio Adapted from Charney and Malone. ADA Pocket Guide to Nutrition Assessment, 2004.
Laboratory Values and Hydration: HCT Adapted from Charney and Malone. ADA Pocket Guide to Nutrition Assessment, 2004.
Laboratory Values and Hydration: Alb, Na+ Adapted from Charney and Malone. ADA Pocket Guide to Nutrition Assessment, 2004.
Laboratory Values and Hydration Status Adapted from Charney and Malone. ADA Pocket Guide to Nutrition Assessment, 2004.
Laboratory Values and Hydration Status Adapted from Charney and Malone. ADA Pocket Guide to Nutrition Assessment, 2004.
Hypokalemia (K+< 3.5 mEq/L) • ↑ renal losses (diuresis) • ↑ GI losses (diarrhea, vomiting, fistula) • K+ wasting meds (thiazide and loop diuretics, etc) • Shift into cells (anabolism, refeeding, correction of glucosuria or DKA) • Inadequate intake
Hyperkalemia (K+>5.0 mEq/L) • Decreased renal excretion as in acute or chronic renal failure • Medications, e.g. potassium sparing diuretics, beta blockers, ACE inhibitors • Shift out of cells (acidosis, tissue necrosis, GI hemorrhage, hemolysis)
Serum Calcium • Normal serum 9.0-10.5 mg/dL (includes ionized calcium and calcium bound to protein, primarily albumin, and ions) • Ionized calcium: 4.5-5.6 mg/dL • Normal levels maintained by hormonal regulation using skeletal reserves • Ionized calcium is more accurate, especially in pt with hypoalbuminemia; evaluate before repleting Ca+ Charney and Malone, 2004, p. 89
Hypocalcemia (serum calcium <9.0 mg/dL; ionized Ca+ <4.5 mg/dL) • Hypoalbuminemia • Hypoparathyroidism • Hypomagnesemia • Renal failure, renal tubular necrosis • Vitamin D deficiency or impaired metabolism
Hypercalcemia (serum calcium >10.5 mg/dL; ionized Ca+ >5.6 mg/dL) • Hyperparathyroidism • Some malignancies, especially breast, lung, kidney; multiple myeloma, leukemia, lymphoma • Medications: thiazide diuretics, lithium, vitamin A toxicity • Immobilization • Hyperthyroidism Charney and Malone, 2004, p. 91
Serum Phosphorus (normal 3.0-4.5 mg/dL) • Serum phos a poor reflection of body stores because <1% is in ECF • Bones serve as a reservoir
Hypophosphatemia (<3.0 mg/dL) • Impaired absorption (diarrhea, Vitamin D deficiency, impaired metabolism) • Medications: phosphate binding antacids, sucralfate, insulin, steroids) • Alcoholism, especially during withdrawal • Intracellular shifts in alkalosis, anabolism, neoplasms • Refeeding syndrome • Increased losses: hyperparathyroidism, renal tubular defects, DKA recovery, hypomagnesemia, diuretic phase of ATN Charney and Malone, 2004, p. 93
Hyperphosphatemia (>4.5 mg/dL) • Decreased renal excretion: acute or chronic renal failure (GFR<20-25 mL/min); hypoparathyroidism • Increased cellular release: tissue necrosis, tumor lysis syndrome • Increased exogenous phosphorus load or absorption, phosphorus containing laxatives or enemas, vitamin D excess • Acidosis
Hypomagnesemia <1.3 mEq/L (normal 1.3-2.1 mEq/L) • Decreased absorption: prolonged diarrhea, intestinal or biliary fistula, intestinal resection or bypass, steatorrhea, ulcerative colitis; upper GI fluid loss, gastric suctioning, vomiting • Renal losses: osmotic diuresis, DM with glucosuria, correction of DKA, renal disease with magnesium wasting, hypophosphatemia, hypercalcemia, hyperthyroidism • Alcoholism • Inadequate intake: malnutrition • Medications • Intracellular shift: acute pancreatitis • Refeeding syndrome
Hypermagnesemia (>2.1 mEq/L) • Acute or chronic renal failure
Assessment for Protein-Calorie Malnutrition Hormonal and cell-mediated response to stress Negative acute-phase respondents Positive acute-phase respondents Nitrogen balance
Assessment for Protein-Calorie Malnutrition–cont’d Hepatic transport proteins Albumin Transferrin Prealbumin Retinol-binding protein C-reactive protein Creatinine Immunocompetence
Hormonal and Cell-Mediated Response to Inflammatory Stress • Acute illness or trauma causes inflammatory stress • Cytokines (interleukin-1, interleukin-6 and tumor necrosis factor) reorient hepatic synthesis of plasma proteins • Although protein-energy malnutrition can occur simultaneously, interpretation of plasma proteins is problematic
Hormonal and Cell-Mediated Response to Inflammatory Stress • Negative acute-phase respondents (albumin, transthyretin or prealbumin, transferrin, retinol-binding protein) decrease • Positive acute-phase reactants (C-reactive protein, orosomucoid, fibrinogen) increase • The change in these proteins is proportional to the physiological insult
Nitrogen Balance Studies • Oldest biochemical technique for assessment protein status • Based on the fact that 16% of protein is nitrogen • Nitrogen intake is compared to nitrogen output, adjusted for insensible losses (skin, hair loss, sweat)
Nitrogen Balance Studies • Nitrogen balance in healthy adults is 0 • Nitrogen balance is positive in growing children, pregnant women, adults gaining weight or recovering from illness or injury • Nitrogen balance is negative during starvation, catabolism, PEM
Nitrogen Balance Calculations • Nitrogen balance = nitrogen intake (g/24 hours) –(urinary nitrogen [g/24 hours) + 2 g/24 hours • Use correction of 4 g/24 hours if urinary urea nitrogen is used • Nitrogen intake = (grams protein/24 hours)/6.25
Nitrogen Balance Challenges • Urea nitrogen is highly variable as a percent of total nitrogen excreted • It is nearly impossible to capture an accurate nitrogen intake for patients taking food po • Most useful in evaluating the appropriateness of defined feedings, e.g. enteral and parenteral feedings
Visceral Proteins: Serum Albumin • Reference range: 3.5-5.2 g/dl • Abundant in serum, stable (half-life 3 weeks) • Preserved in the presence of starvation (marasmus) • Negative acute phase reactant (declines with the inflammatory process) • Large extravascular pool (leaves and returns to the circulation, making levels difficult to interpret) • Therefore, albumin is a mediocre indicator of nutritional status, but a very good predictor of morbidity and mortality
Visceral Proteins: Plasma Transferrin • Reference range: 200-400 mg/dl • Half-life: 1 week • Negative acute phase respondent • Increases when iron stores are depleted so affected by iron status as well as protein-energy status • Responds too slowly to be useful in an acute setting