Basic Concepts for Ordination
Basic Concepts for Ordination. Tanya, Nick, Caroline . What is ordination?. Puts information in order of importance to the researcher There are two types of ordination Direct Ordination Indirect Ordination . Direct Ordination.

Basic Concepts for Ordination
E N D
Presentation Transcript
Basic Concepts for Ordination Tanya, Nick, Caroline
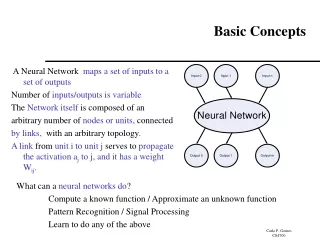
What is ordination? • Puts information in order of importance to the researcher • There are two types of ordination • Direct Ordination • Indirect Ordination
Direct Ordination • Places information in order with respect to a pre-defined environmental measure • Time (Generation) • Distance • Elevation
Indirect Ordination • Abstract – tries to make a meaningful summary of the patterns underlying the data • Creates graphs or diagrams that show the relationships among data points • Data space • Multidimensional mathematic space where each variable represents a dimension
Indirect Ordination vs. Regression • Regression makes one variable dependent on the others • Indirect Ordination treats all variables as equals • Indirect Ordination works well for co-correlated data whereas regression does not
Raw Data vs. Ordinated Data • In raw data axes correspond to some measurement made by the researcher • All axes are equally important • In ordinated data the numbers on the axes are ordination scores • Axes produced ordination are in descending order of importance • Ordination scores – abstract way of measuring ordinated data • Has no relation to raw data
Ordination Diagram • Points that are close together are similar and contain similar measurements, while points that are far apart are very different and contain different measurements
Setting Up Ordination • Choosing variables is subjective • Excluding variables should be robust • Repeat ordination several times • Typical to restrict to one type of variable • Ex. Given biological data or chemical data or climate data etc.
Bray-Curtis Ordination • Can be done by hand without a computer • Simplest of all indirect ordinations • Rectangular matrix of data is created • Matrix is converted into a square matrix that quantifies differences between samples • Two samples are chosen as the end points and are used to construct a scale diagram • Second set of samples is chosen to construct another axis • Process is repeated
Limitations of Bray-Curtis • Being subjective and arbitrary • Many permutations to select endpoints and distance indices • Many techniques possible to describe the same data set – this gives 40 different possible permutations • Sensitive to outliers • Geometry may fail to work • Not a simple calculation – amount of work goes with the square of the number of samples
Dissimilarity Matrix • Essentially this matrix is made up of numbers (dissimilarity indices) that represent the difference between pairs of samples • Dissimilarity index between a sample and itself is zero • For different types of data, there are different formulas for calculating the dissimilarity indices
Defining End-Points • Once we have the dissimilarities between all samples have been calculated, two samples need to be chosen as the end-points • the simplest way to choose the endpoints is to choose the two points that are most dissimilar (have the largest dissimilarity index – close to 1 being the most dissimilar)
Graphing Ordination Scores • First you have to construct the first ordination axis with the endpoints • Then you have to draw a circle with the radius representing the distance between the first endpoint and the point your are plotting and repeat the process with the second endpoint • Where the two circles intersect is where your point is located