Download

1 / 19
190 likes | 338 Views
Jennie Price. Chief Executive Sport England. Sport and Recreation Alliance Conference Delivering Government’s priorities for sport. Government’s current priorities What we have learnt Future direction of travel The Big Society – how does it fit in. Government’s current priorities.

E N D
Jennie Price Chief Executive Sport England Sport and Recreation Alliance Conference Delivering Government’s priorities for sport
Government’s current priorities What we have learnt Future direction of travel The Big Society – how does it fit in
Priorities for grassroots sport Greater impact More people playing more often For its own sake And for the wider benefits Cost reduction Value for money In tune with wider policy agendas: Localism Private and voluntary sectors in the lead Big Society
Signals in the Comprehensive Spending Review Sport England - 33% cut in Exchequer Revenue over 4 years And a 40% cut per year in Exchequer capital UK Sport – 28% reduction in Exchequer funding over 4 years Reduced DfE funding for the school sport network 26% reduction in local authority funding over four years Protect investment in NGBs Deliver savings through the merger with UK Sport
And… More lottery funding Return to the four pillars End of Olympic ‘take’ in 2012/13 Dependence on ticket sales 6
More broadly Structural changes in the NHS No RDAs Fewer cross Departmental programmes Less money in the third sector
There is variation in NGB progress towards growth targets Change in once a week participation for key funded sports 275,000 10 positive 19 negative Athletics 225,000 175,000 125,000 Cycling 75,000 Squash & racketball Mountaineering Table Tennis Once a week participation (adults) Baseball/softball Netball Canoeing 25,000 Boxing Judo -25,000 Fencing Rounders Snowsport Hockey Rowing Volleyball Sailing Equestrian Bowls** Cricket Badminton Basketball Football -75,000 Gymnastics & Trampolining* Rugby League* Tennis Rugby Union -125,000 Golf Swimming -175,000 Source: APS5Q1 compared with APS2 (baseline), chart shows change on baseline for sports shown, i.e. their progress towards their growth target. Sports in red have seen a negative trend (i.e. 1 x 30 participation is lower than at baseline by the amounts shown)
Age group patterns are emerging Drop Off 16-18 yrs remain high 20 + yr olds sustaining participation Drop Off now significant at 27 + yr olds Growth appearing at 37 – 39 yrs olds Late 40’s sustaining participation % adults Age Source: APS1 and APS4 Q3, chart shows proportion of adults that take part in 3 x 30 sport (the ‘one million’ indicator)
Clear patterns of participation are emerging by sport Athletics = frequent habit Badminton = volumes at once a week levels 1 x p.w. 2 x p.w. 1 x p.w. 3 x p.w. % adults % adults 5 x p.w. 4 x p.w. 2 x p.w. Number of sessions per month (from 0 on left to 28 on right) Number of sessions per month (from 0 on left to 28 on right) Source: APS data based on adult participation in the past 28 days. 1 x p.w. is four sessions per month, 2 x p.w. is 8 sessions per month and the blocks in between show the people taking part at frequencies between these levels
NGBs need to look outside the traditional club setting to reach new participants Changed approach to focus on non-club participants Expanding focus beyond club structure Planning to use club structure in new and different ways Source: Active People Survey 4 quarter 3 (July 2009 to July 2010). Total bar (combining light and dark blue) shows the number of adult participants in that sport defined as a 30 minute, moderate intensity session at least one day in the previous 28 days. Of these, club members are defined as participants that have been a member of a sports club so that they can participate in that sport in the last four weeks. Other participants are the total participants minus club members.
Commercial sector is a growing influence on participation rates Finding profitable demand • Commercial companies driving the running ‘boom’ • 5 a side football numbers driven by commercial sector • Over 1 million people running in commercial events each year • Powerleague plans expansion from 44 to 200 sites in next two years • Continuing to evolve products and services to maintain interest • Different ways of satisfying demand for participation • Gym classes constantly changing products • British Cycling largely driven by Sky • Ping! Ideas from the commercial arts sector Developing innovation
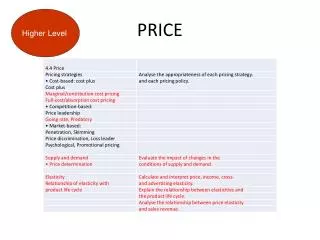
Local authorities will have different approaches to sport in response to funding cuts Priority choices Increasing council tax Same for more: PRICE Increasing fees and charges Less for less: CUTS Demand management restricting access to services Service cuts Redundancies Asset management Savings through partnerships Recruitment freeze Same for less: EFFICIENCY Efficient procurement Outsourcing Back office efficiency Redundancies Delivery in partnership Service redesign More for less: REDESIGN Prevention Strategic Commissioning Demand management reducing need Based on Audit Commission, Surviving the Crunch, 2010
Local authorities and education are key facility providers, so funding cuts could impact on provision and access Source: Active Places Power. This chart shows the distribution of facilities according to ownership based on January 2011 data. This analysis does not take into account the volumes of participants in each type of facility, or the access that is permitted to these (for instance education sites may or may not be accessible for community use).
Ministers’ first request: a mass participation legacy plan Places Play People Gold Challenge (£3m) Sportivate (£32m) Sport Makers (£4m) Iconic facilities (£30m) Inspired facilities (£50m) Protecting Playing fields (£10m) Disability Sport (£8m) School Games (£35.5m) NGB investment – Mass Participation Programmes
2011/12 is a transitional year NGB Whole Sport Plans Places People Play School Games Funding Local Provision Statutory roles and funded partners Strategic work/ market development Admin costs
The Big Society in sport More local decision making Less ring fencing of spend, more devolution to individuals Asset transfer Emphasis on the voluntary sector Transparency and public accountability Impact not ‘targets’